

Getting the Right Level of Detail in a Profitability & Cost Model
A practical guide to calibrating granularity, causality, and assignment sequencing in ABC/M, TDABC, and multi-dimensional PCM models
Originally published as an IMA Profitability & Cost Management Shared Interest Group whitepaper.
Executive Summary
One of the most common mistakes in implementing profitability and cost management models is designing the model at a level of detail that does not align with the business objective it is meant to address. Excessive granularity does not improve decision quality; it destroys it.
This whitepaper presents a practical framework for determining the optimal level of detail in Profitability and Cost Management (PCM) models, whether implemented using traditional ABC/M methodology, Time-Driven Activity-Based Costing (TDABC), or modern multi-dimensional costing platforms. It integrates over two decades of model design experience across more than 15 countries with the latest research on granularity, causality, and model sustainability.
The result is a guide of nine principles and a validated assignment sequence designed so that CFOs, controllers, and FP&A teams can calibrate their models without sacrificing causality or turning the initiative into an unsustainable project.
Central Thesis: The precision of a cost model is not a function of the volume of data it processes, but of the quality of its structural design: the selection of causal drivers, the level of activity disaggregation, and the hierarchy of cost objects.
1. The Problem: Oversized Models
In a meeting with the executive committee of an industrial group, the CFO told me with visible frustration: "We have 4,200 activities in the model and nobody uses it. The plant managers stopped submitting data three months ago."
This scenario repeats with alarming frequency. Organizations that invest between 6 and 18 months implementing an ABC/M model end up with a technical artifact that nobody adopts, because the cost of maintaining it exceeds the perceived benefit by those who must make decisions with its output.
Kaplan and Anderson identified this pattern in 2004 when they introduced TDABC as a direct response to the complexity and maintenance cost of traditional ABC models. Their central critique was that employee surveys to estimate activity times were costly, subjective, and difficult to update. However, the solution was not to eliminate ABC, but to simplify its calculation engine without losing causality.
The real challenge is not technical; it is one of design. The right question is not "how many activities do we need", but "what decisions does each stakeholder need to make, and what level of distortion is tolerable for each one."
1.1 What Fails in Practice
Excess activities without materiality. Models with over 500 activities, in which 80% represent less than 5% of the total cost. The effort of collecting drivers for immaterial activities generates no improvement in the precision of the final result.
Drivers without causal relationships. Using volumetric allocations (revenue, headcount) to assign costs that have entirely different behavioral drivers. This is not ABC; it is traditional accounting with more steps.
Cost objects disaggregated beyond any consumer of the information. Calculating profitability at the SKU-customer-store-week level when no operational manager has the authority or capacity to act at that level of detail.
Absence of model governance. No defined process exists for updating drivers, validating results, or scaling the model when the business changes.
2. Conceptual Framework: Precision vs. Results
Charles T. Horngren of Stanford articulated a principle that remains valid: before implementing any measurement model, a cost-benefit analysis must be conducted comparing the model's estimated costs with the probable benefits it will generate. This principle applies directly to the design of PCM models.
2.1 The Reliability vs. Detail Curve
In statistical analysis, there is an inflection point where adding more detail does not significantly increase the reliability of the result. In cost modeling practice, this point is typically reached at the Pareto level (80/20):
The top 20% of cost types represent 80% of the total value chain cost. Identifying and correctly modeling the 20% with high-quality causal drivers yields a model that is significantly more precise than modeling 100% with generic drivers.
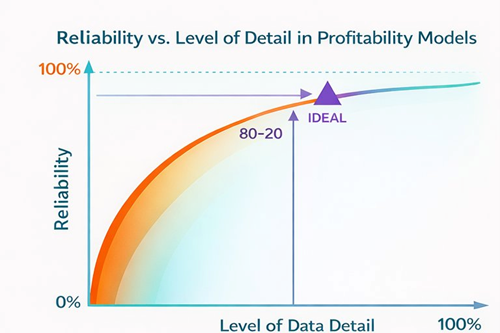
Figure 1 — Reliability vs. Level of Detail in Profitability Models
Design Principle: An ABC/M model does not replace the financial accounting system. It serves as an analytical lens that restructures general ledger data and operational metrics to support more effective decision-making.
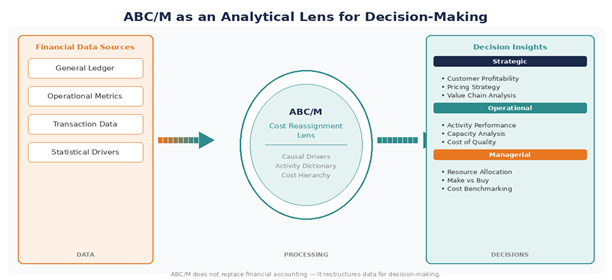
Figure 2 — ABC/M as an Analytical Lens for Decision-Making
2.2 Structure Beats Data
The precision of the results depends more on how the model is structured than on the data itself. A well-designed model with 40 activities and causal drivers will outperform a model with 400 activities and generic drivers in decision quality. The model structure is what purges the distortion inherent in accounting data.
This is expressed in four levels of driver precision, from lowest to highest causal quality:
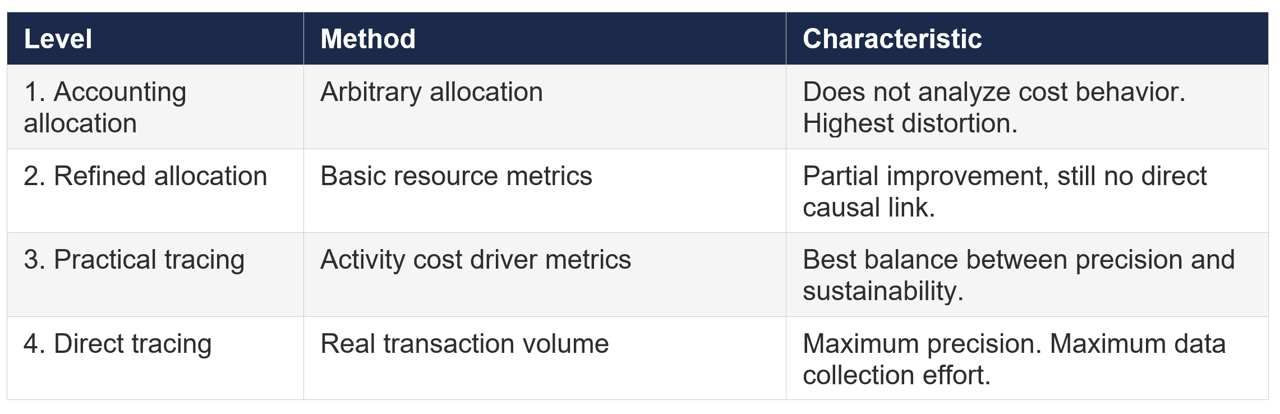
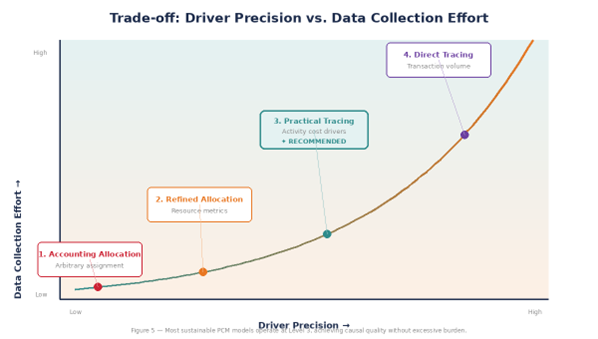
Figure 3 — Trade-off Between Driver Precision and Data Collection Effort
Recommendation: For most profitability models in mid-to-large organizations, Level 3 (practical tracing) offers the best balance between causal quality and operational sustainability. Level 4 should be reserved exclusively for cost components with the highest materiality and distortion.
2.3 The PCM Detail Trap
One of the most valuable mental models for PCM practitioners is the Detail Trap: a three-zone framework that maps the relationship between model granularity and decision quality. Every profitability model sits somewhere on this spectrum. The goal of model design is to keep the organization in the Optimal Zone.
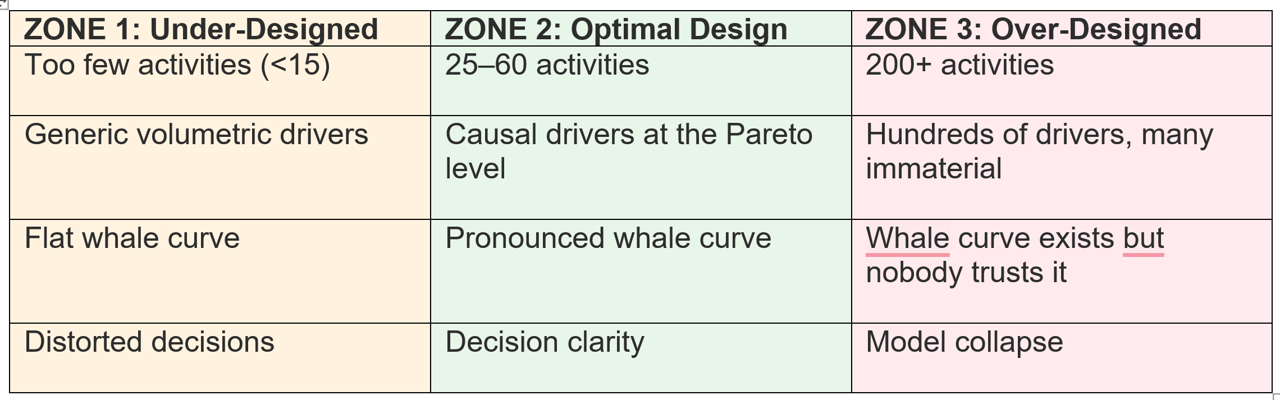
Figure 4 — The PCM Detail Trap: Three Zones of Model Granularity
The Detail Trap is not symmetric. Organizations that fall into Zone 3 (over-design) face a more insidious problem than those in Zone 1: over-designed models appear rigorous but erode trust when stakeholders cannot reconcile the outputs with their operational reality. The cost of maintaining an over-designed model eventually exceeds its analytical value, leading to abandonment — the most expensive outcome of all.
2.4 The Cost Model Design Pyramid
The five calibration criteria form a hierarchical framework we call the Cost Model Design Pyramid. Each layer must be resolved before the next can be effectively addressed. Skipping a layer — or addressing them out of sequence — is the root cause of most model failures.
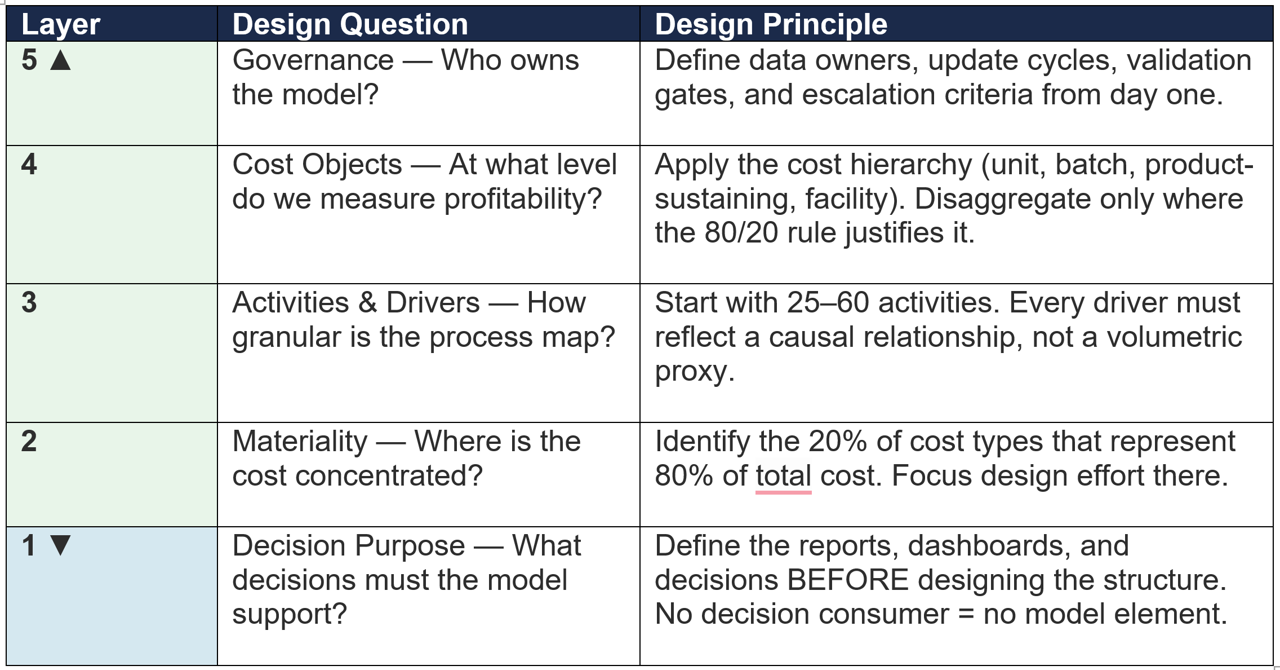
Figure 5 — The Cost Model Design Pyramid
The pyramid reads bottom-up: decision purpose is the foundation. Every design choice above it must be traceable to a specific decision that the model enables. If an activity, driver, or cost object cannot be linked to a decision consumer, it should not exist in the model.
3. Five Criteria to Calibrate the Level of Detail
Before starting the design of any profitability model, a clear vision of the destination must be built. These five criteria, validated across real-world implementations in multiple industries and geographies, constitute the design checklist:
3.1 Information needs of the model
ABC/M can generate information for multiple types of analysis, including multidimensional profitability, capacity analysis, benchmarking, cost of quality, pricing strategy, and make-or-buy decisions. However, in practice, it is critical to establish the model's primary use from the outset.
This means answering three concrete questions: (a) Who will use the information and what decisions will they make with it, (b) How frequently is the information needed, and (c) What level of precision is necessary for the decision to be different from the one that would be made without the model.
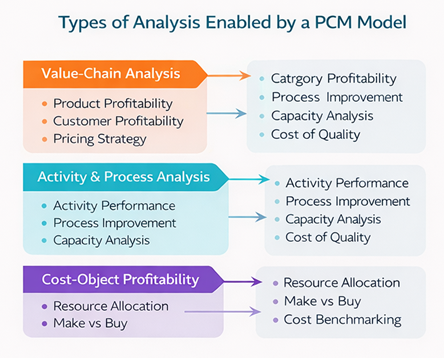
Figure 6 — Types of Analysis Enabled by a PCM Model
3.2 Materiality of the cost base
Even companies in the same industry competing for the same customers have different resource mixes in their value chains. Before designing the model, identify the top 20% of cost types that account for 80% of the total cost, and assess the distortion each component generates for each driver.
Common mistake: Copying the ABC/M model from one business unit to another without recalibrating materiality. Even within the same organization, different regions or product lines have radically different cost profiles.
3.3 Activity and driver disaggregation
The degree of value chain disaggregation into processes and activities directly affects both the number of required drivers and the precision of assignments. As disaggregation increases, costing precision improves, but the collection and maintenance effort grows non-linearly.
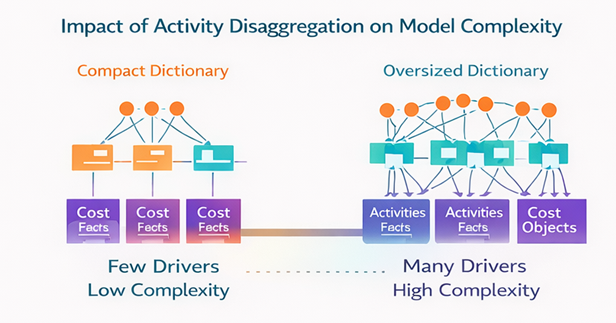
Figure 7 — Impact of Activity Disaggregation on Model Complexity
The practical recommendation is to start with a compact activity dictionary (between 25 and 60 activities for most organizations) and expand selectively only where the materiality analysis justifies it.
3.4 Cost object hierarchy
The number of cost objects and their level of disaggregation directly affect model complexity. Clear hierarchies must be established to enable the 80/20 principle: individually identify significant cost objects (e.g., key customers or products) and group the rest into categories with similar characteristics and consumption levels.
The four hierarchical levels of ABC theory (unit-level, batch-level, product-sustaining, and facility-level) remain the most robust framework for organizing this hierarchy in any PCM implementation.
3.5 Quality of the accounting source
The general ledger is the raw material of the model. Being regulated by internal controls, audit, and accounting standards, it offers a reasonable level of confidence. However, an ABC/M model does not replace or correct deficiencies in financial accounting. If the ledger is unreliable, the model will amplify its errors rather than correct them.
Field Lesson: A broadcasting company attempted to use an ABC/M project to compensate for the lack of reliable accounting information. After months of work, the team understood that ABC/M does not replace the accounting system: it requires it as a fundamental input.
4. Assignment Sequence in a PCM Model
The assignment sequence (allocation waterfall) is not arbitrary. It follows a causal-cascade logic in which each assignment group eliminates a source of ambiguity before passing it on to the next. A cost should never be assigned to a customer that has not yet been properly costed upstream.
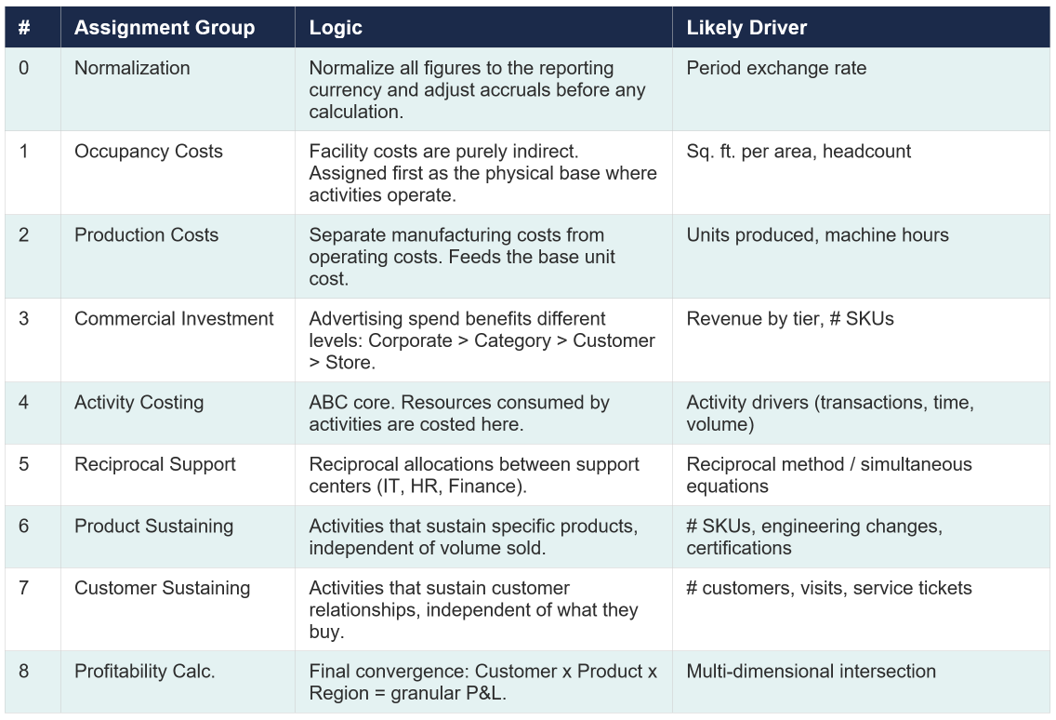
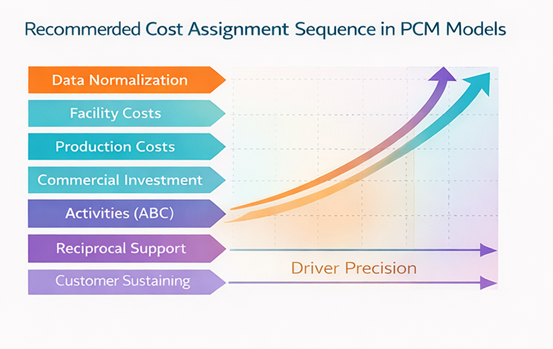
Figure 8 — Recommended Cost Assignment Sequence in PCM Models
4.1 Governing Principle of the Flow
The flow follows this logical sequence: Clean data > Facility fixed costs > Production costs > Commercial investment > Activities > Reciprocal support > Product sustaining > Customer sustaining > FINAL PROFITABILITY.
Each group eliminates a source of ambiguity before passing to the next. If this order is altered, downstream costs will inherit distortions from steps that should have been executed first.
4.2 Customer Sustaining: The Most Underestimated Step
In our experience, Customer Sustaining is where most organizations have the greatest opportunity for improvement. Post-sale service activities, internal account management (inside sales), and field management (outside sales) are rarely assigned to the customer that consumes them. The result is an artificially flat customer profitability curve that conceals the fact that the bottom 20–25% of customers are destroying the margin generated by the top 20%.
The whale curve is the litmus test of model quality. If your profitability model does not reveal a pronounced whale curve where cumulative profit peaks well above 100% of actual profit before declining, the model is likely under-assigning cost-to-serve.
5. Traditional ABC vs. TDABC vs. Multi-Dimensional Costing
There is no single correct method. The selection of approach depends on the operational context, the organization's analytical maturity, and sustainability constraints:
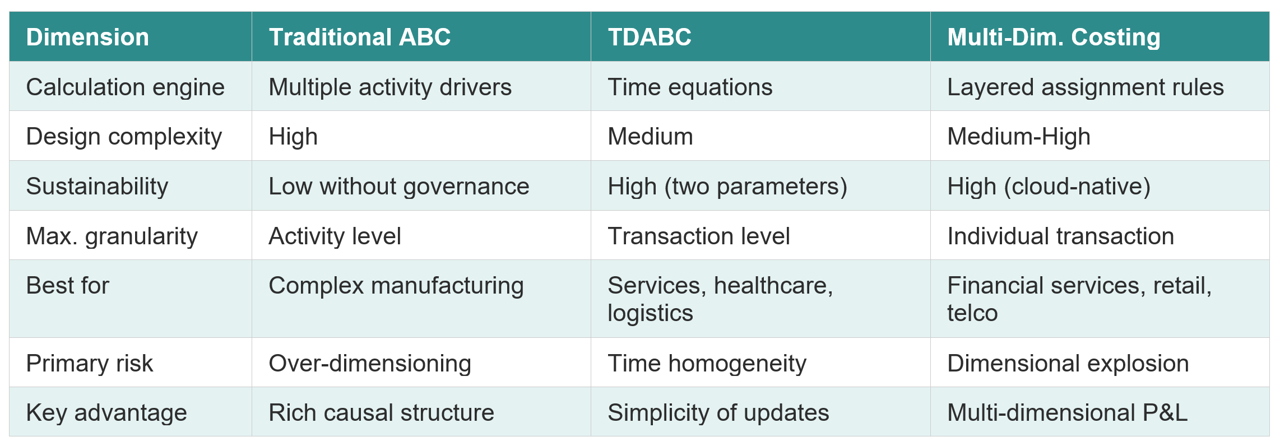
Practical note: In real-world implementations, the most successful models combine elements of all three approaches. A well-designed PCM model can use ABC logic for indirect costs, time equations for shared service centers, and direct transactional assignment for direct costs. Methodological purity is less important than causality and sustainability.
6. Field Case: Regional Bank Profitability Model Redesign
The following case illustrates the practical application of the principles described in this whitepaper. While specific identifiers have been anonymized, the metrics and outcomes are drawn from an actual engagement.
6.1 Context
A mid-sized regional bank in Latin America with approximately USD 2.4 billion in assets had implemented an ABC/M profitability model four years earlier. The model was designed by an external consulting firm using a "comprehensive" approach that aimed to capture every process in the bank's value chain.
The original model contained 420 activities and over 300 cost drivers. Monthly processing required a dedicated analyst working for approximately 12 business days. Branch managers and product heads had largely stopped using the model outputs, citing two recurring complaints: the numbers "did not match their reality," and the reports arrived too late to inform decisions.
6.2 Diagnosis
Applying the five calibration criteria from Section 3, the diagnostic revealed four critical issues:
First, 78% of activities represented less than 4% of total operating cost. Second, over 60% of drivers were volumetric proxies (headcount, transaction count) with no causal relationship to the cost they assigned. Third, the cost object hierarchy lacked a customer-sustaining layer — all post-sale service costs were allocated uniformly across the customer base. Fourth, no formal governance process existed: driver data was collected ad hoc, and results were never validated against operational benchmarks.
6.3 Redesign
The model was redesigned following the Cost Model Design Pyramid (Section 2.4), starting from the decision purpose and working upward:
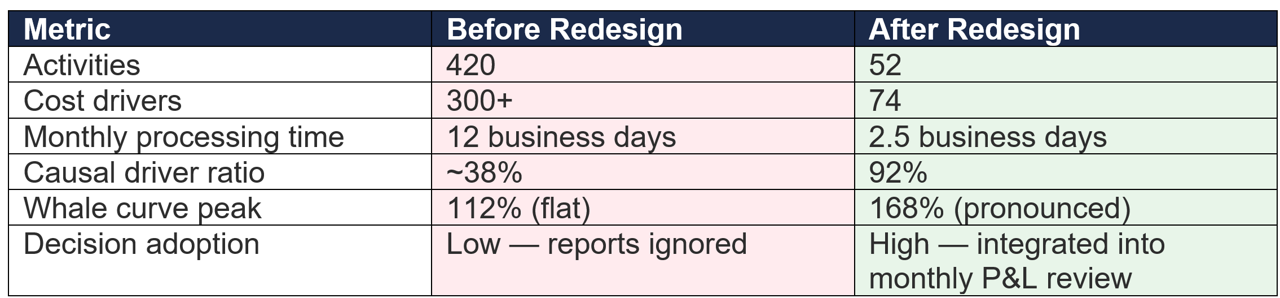
Figure 9 — Before/After: Regional Bank Profitability Model Redesign
6.4 Key Takeaways
The redesigned model reduced activities by 88% and drivers by 75%, yet produced a whale curve with 50% greater visibility into profit concentration. The critical insight was not that the bank needed fewer numbers — it needed better-designed numbers. Processing time dropped by approximately 80%, enabling the finance team to deliver results within the first week of each month, which was the operational threshold required for the outputs to influence branch-level decisions.
This case validates the core thesis of this whitepaper: a compact, causally sound model will always outperform a comprehensive but structurally flawed one.
7. Nine Principles for the Right Level of Detail
Synthesizing field experience with available literature, these nine principles constitute the practical guide for calibrating any profitability and cost model:
Principle 1: Start with the end in mind. Define the reports, dashboards, and decisions the model must support BEFORE designing the structure. If there is no consumer of the information, there is no reason to model it.
Principle 2: Materiality first. Identify the 20% of cost components that represent 80% of the total. Focus design effort and causal drivers on that segment.
Principle 3: Causality over volume. Every driver must reflect a real cause-and-effect relationship. If the only available driver is revenue or headcount, the model is performing disguised allocation rather than ABC.
Principle 4: Scale the activity dictionary. Start with 25–60 activities. Expand only where distortion analysis justifies it quantitatively.
Principle 5: Respect the cost hierarchy. Unit-level, batch-level, product-sustaining, facility-level. Do not mix hierarchical levels in a single assignment.
Principle 6: Sustain before expanding. A model that runs monthly and stays up to date is worth more than a perfect model calculated once a year.
Principle 7: Design for 90%, not 100%. The reliability vs. detail curve has diminishing returns. The last 10% of precision may require 50% of total effort.
Principle 8: Validate with the Whale Curve. If the model does not reveal a non-uniform distribution of customer profitability (the typical whale curve), it is likely underassigning cost-to-serve.
Principle 9: Governance from day one. Define data owners, driver update frequency, validation processes, and model escalation criteria.
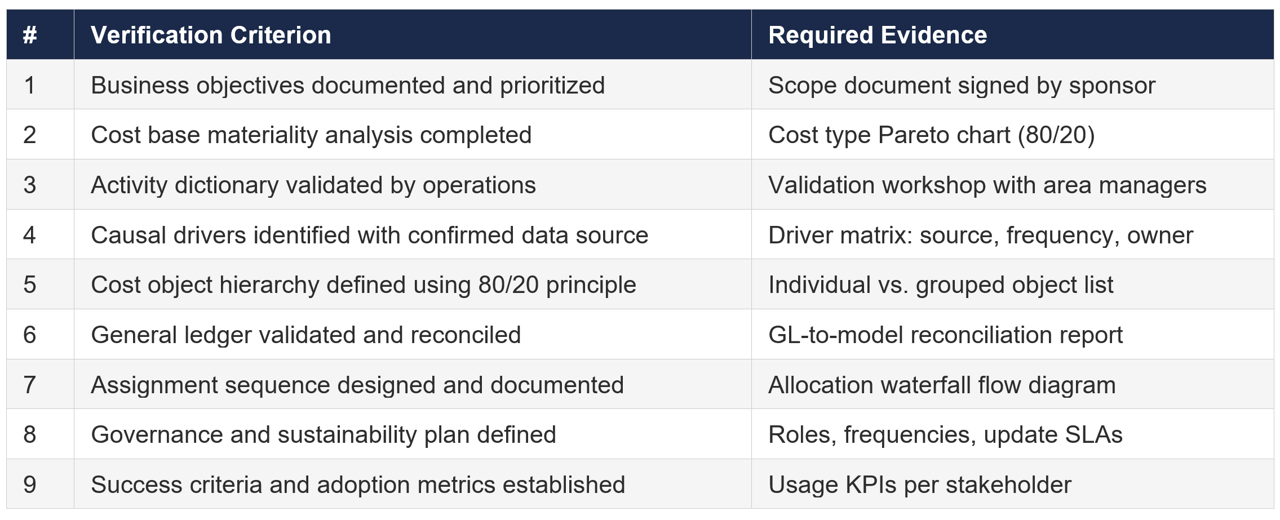
8. Design Checklist: Before Building the Model
Use this checklist as a quality gate before entering the build phase in any PCM platform:
9. Conclusion: The Art of Balance
In over two decades of designing profitability models, the most consistent lesson I have observed is that the difference between a successful implementation and a "horror story" is rarely technical. It is a matter of design and governance.
The right level of detail is the one that enables each stakeholder to make a better decision with a sustainability effort that the organization can maintain indefinitely. Not one data point more, not one less.
Models that survive and generate value share three characteristics: they start with the end in mind (the decisions they must support), they respect materiality (they model the 20% that explains the 80%), and they have a clear owner (governance from day one).
Cloud-based PCM technology has eliminated many of the technical barriers that made models unsustainable two decades ago. But technology does not compensate for poor design. The challenge remains the same one Horngren articulated in his texts: the balance between precision and practical utility.
Looking Ahead: In the next 3 to 5 years, profitability models that integrate Machine Learning for automatic driver selection and assignment anomaly detection will become the de facto standard in organizations with medium-to-high analytical maturity. The question will not be whether to adopt AI in the cost model, but how to calibrate the model's level of detail to maximize the quality of the input feeding those algorithms
References
Cooper, R. and Kaplan, R.S. (1988). Measure Costs Right: Make the Right Decisions. Harvard Business Review.
Horngren, C.T., Datar, S.M. and Rajan, M.V. (2021). Cost Accounting: A Managerial Emphasis. 16th Edition. Pearson.
Kaplan, R.S. and Anderson, S.R. (2004). Time-Driven Activity-Based Costing. Harvard Business Review, 82(11), 131-138.
Kaplan, R.S. and Anderson, S.R. (2007). Time-Driven Activity-Based Costing: A Simpler and More Powerful Path to Higher Profits. Harvard Business School Press.
San Martin, P. (2001). Nivel de detalle de un modelo ABC/M. Technical Note on Advanced Costing Methods. ITAM.
This whitepaper was originally published by the IMA Profitability & Cost Management Shared Interest Group. To join the IMA PCM SIG, visit imanet.org.
Pedro San Martin, CPA, MBA, CEAP, ADGBS Principal, Strategic Finance Center of Excellence Chair, IMA Profitability & Cost Management Shared Interest Group psanmartin@asher.company