

How hypothesis-led problem solving turned a stalled diagnosis into a decision at a Latin American bank, and how to apply the same method to your next one.
The field lesson
A mid-sized Latin American bank had done almost everything right. The profitability model ran every month on its cloud EPM platform. Costs flowed from cost centers to activities, from activities to products. Every run finished green. Total cost in, total cost out, reconciled to the cent.
Then the CFO's team asked the question the model had been built to answer: what does it cost to serve each channel, each branch, each customer segment?
Five of the six reporting views came back empty. Only one dimension carried cost. The others showed zero, without an error message or a warning, inside a job that had finished green.
The first reaction was the usual one. Ask the bank for more data. Rebuild the drivers. Schedule more meetings. Weeks of work, aimed at a cause nobody had proven.
What broke the impasse was a change of method. The team stopped collecting everything and started testing a few specific explanations, one at a time, against the live system. Within a short series of runs the cause was isolated: it was a design issue in how the reporting rules consumed the same cost pool, not missing data. The fix changed the run design, not the data request.
That method has a name in strategy work: hypothesis-led problem solving. Below is the version we use, adapted to finance and profitability decisions.
Why hypothesis-led, and why now
Most finance teams solve problems by accumulation: gather all the data, analyze it, and wait for the answer to appear. It feels rigorous. In practice it is slow, expensive, and it rewards whoever produces the most spreadsheets.
The hypothesis-led approach reverses the order. You start with your best explanation, state it plainly, and design the smallest test that could prove it wrong. Data is still central. You just collect the data that decides something.
This matters more as AI and EPM platforms make analysis cheap. When every chart can be produced in seconds, the scarce skill is knowing which question to ask and which answer would change the decision.
Step 1 · Define the decision, not the topic
A vague problem produces vague work. "Our profitability model doesn't work" is a topic. "Why does cost not reach the channel and branch views, and what must change so the CFO can rank branches by cost to serve before the next quarterly review?" is a decision.
We capture it on one page, the Decision Statement:
Key question: specific, measurable, with a deadline.
Decision owner: the one person who will act on the answer.
Success criteria: what a good answer looks like, in numbers.
Scope: what is in and what is explicitly out.
Constraints: data, time, systems, policy.
Stakeholders: who must agree, who must be informed.
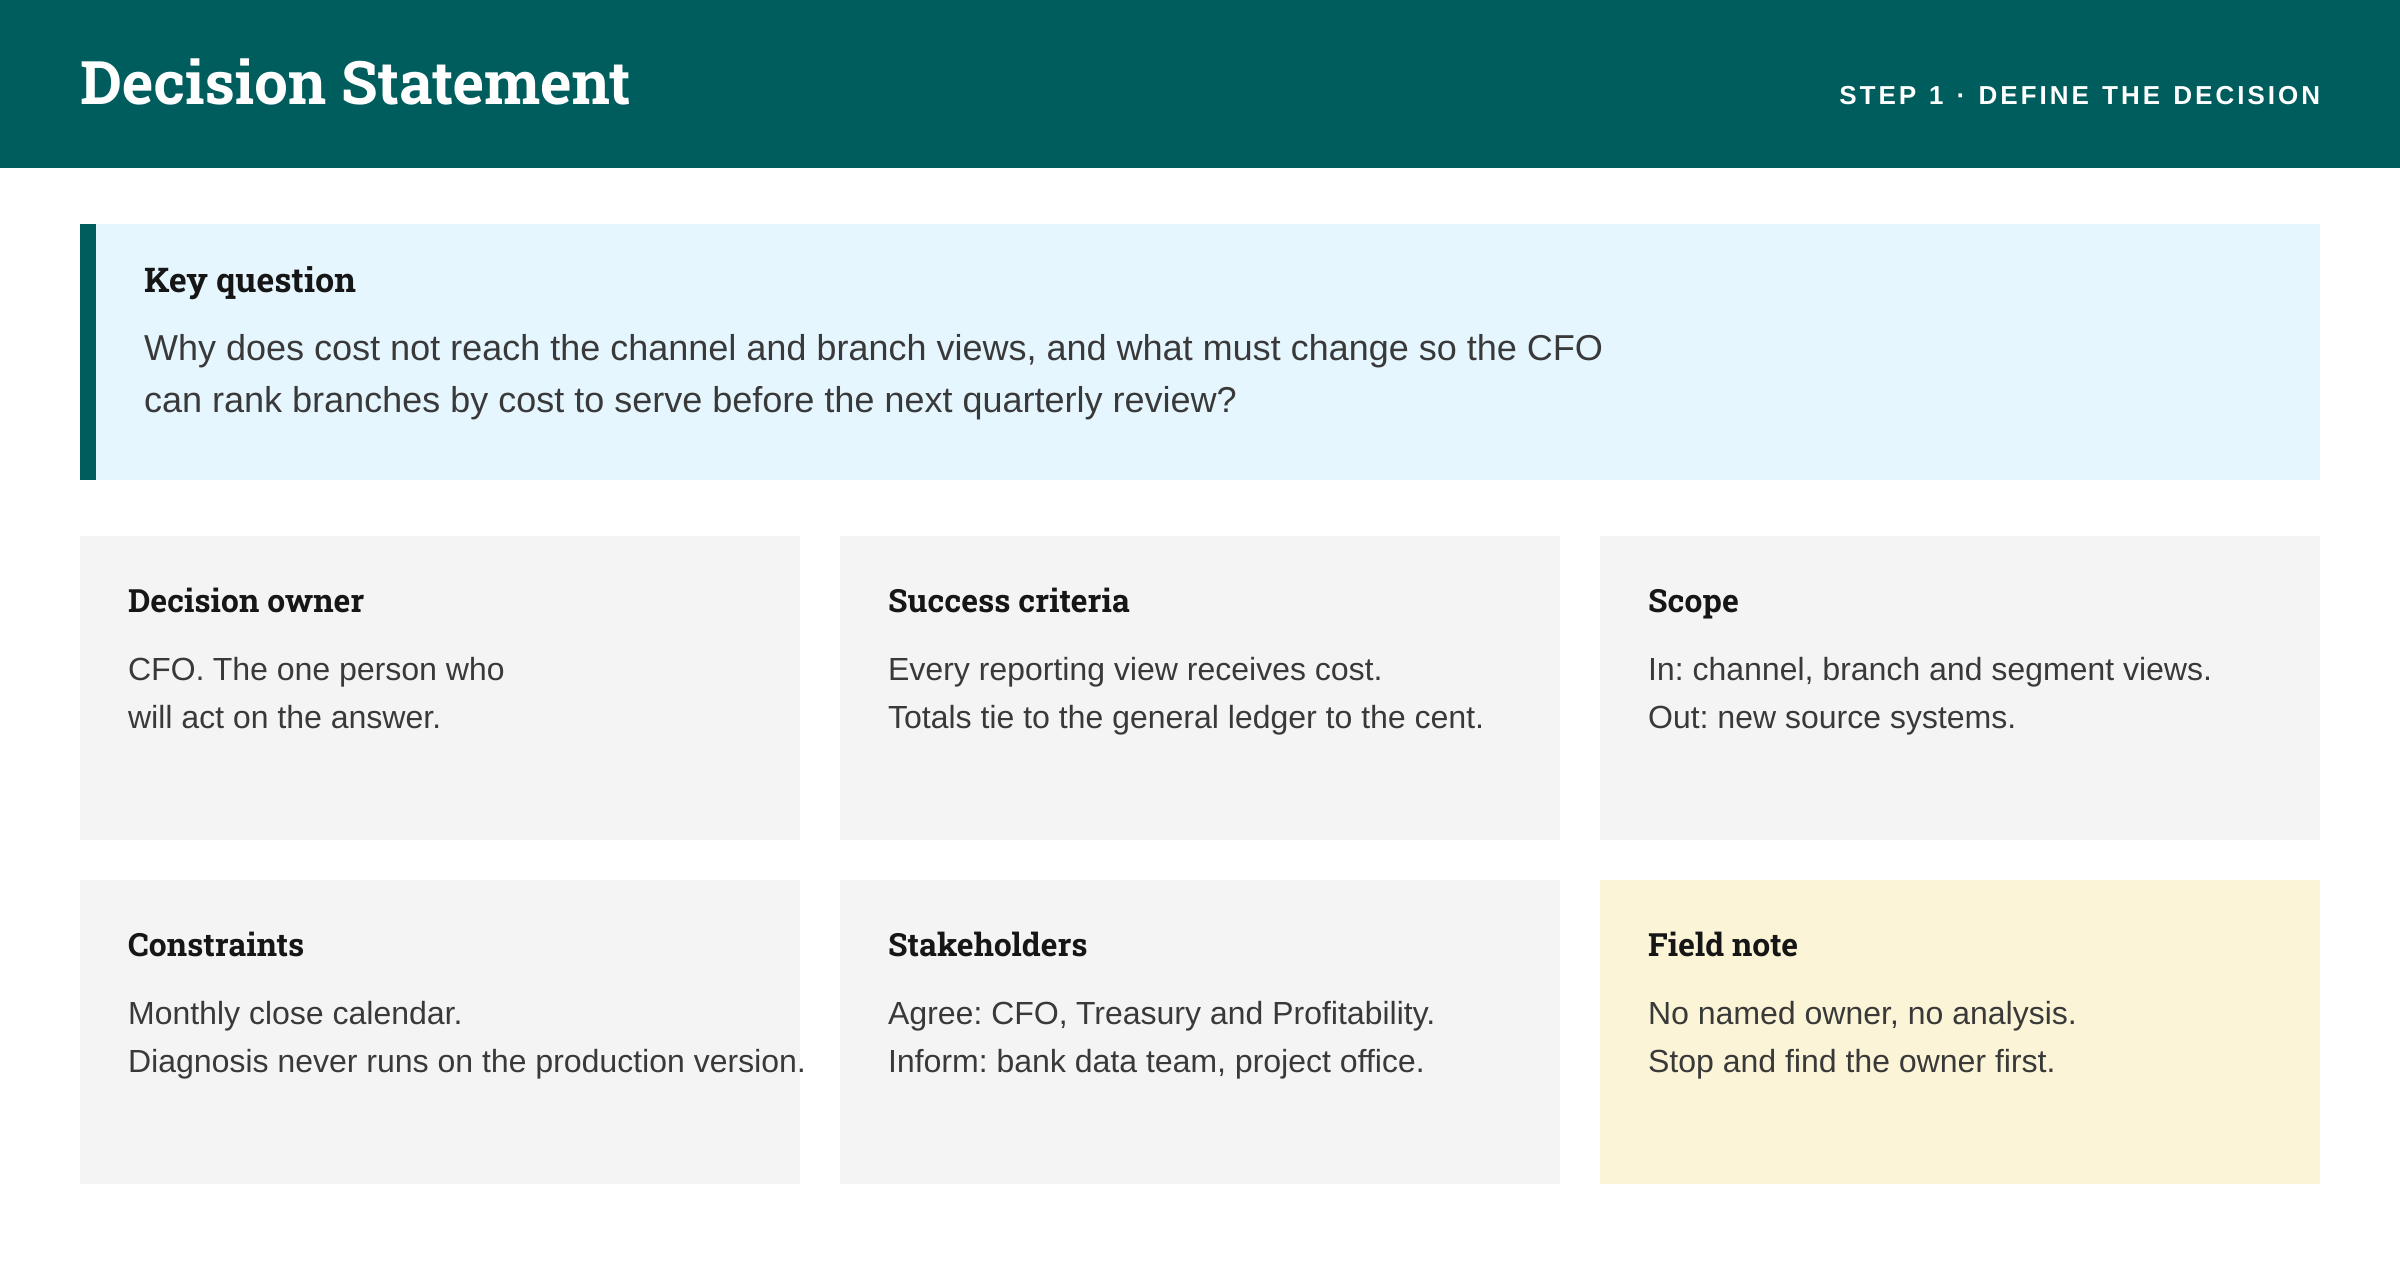
Figure 1. Decision Statement: one page that names the question, the owner and what a good answer looks like.
Field note: if the team cannot name the decision owner, stop. You are about to produce analysis that nobody will use.
Step 2 · Structure the problem into testable hypotheses
Next, break the key question into a hypothesis tree: your governing hypothesis at the top, then the explanations that would have to be true beneath it. When you have no hypothesis yet, use an issue tree of open questions instead and convert it once a pattern emerges.
Each level must be MECE, mutually exclusive and collectively exhaustive: no overlaps, no gaps. That discipline prevents two analysts from chasing the same cause and nobody chasing the real one.
What a hypothesis is. A hypothesis is not a guess and not a topic. It is a specific statement of what you believe is causing the problem, written before you look at the data, so that the data can prove you wrong.
Hypothesis-led work is one of four common ways to attack a problem. What changes between them is where the effort goes.
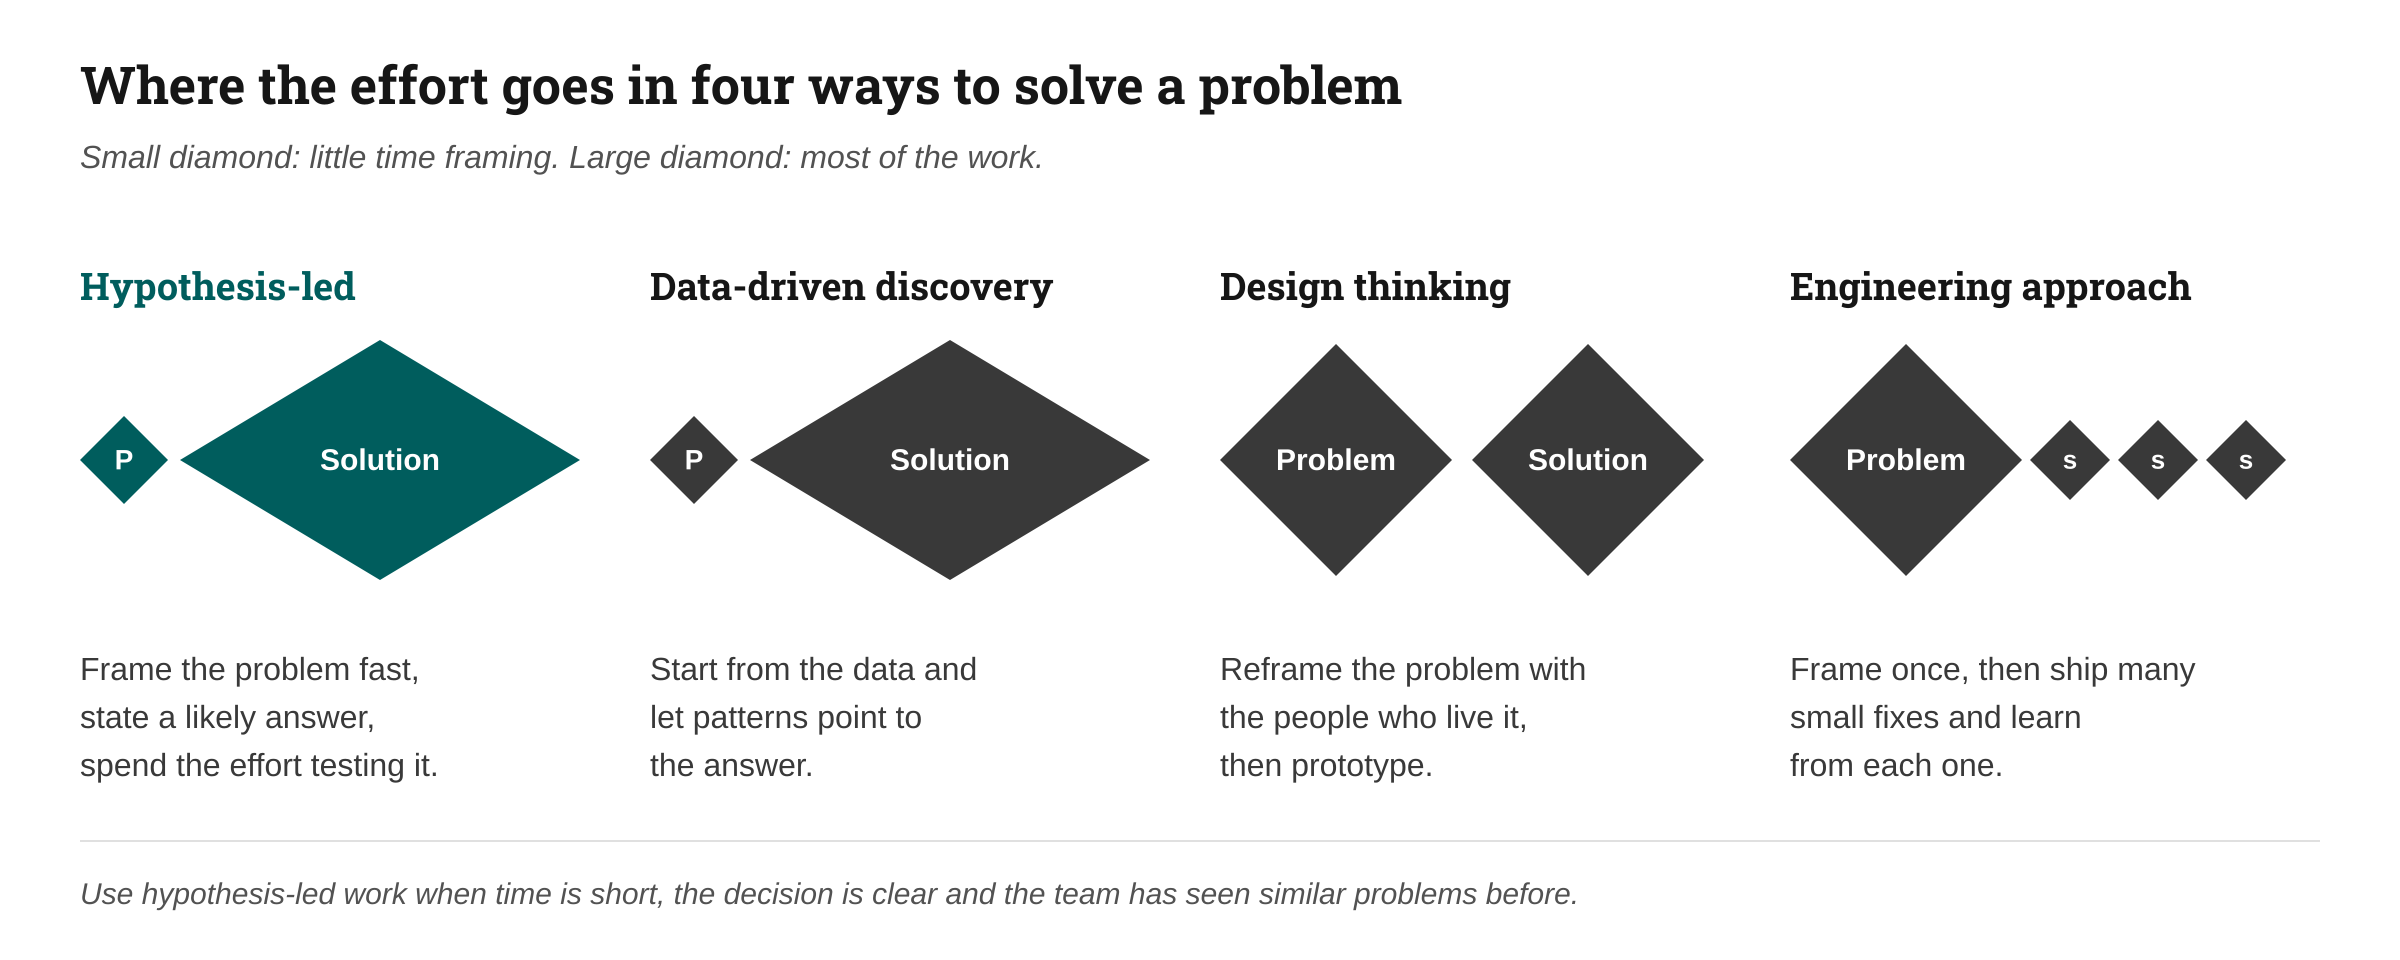
Four ways to solve a problem: hypothesis-led work spends little time framing and most of the effort testing a likely answer.
Hypothesis-led: little time framing the problem, most of the effort testing a likely answer. Best when time is short and the team has seen similar problems.
Data-driven discovery: start from the data and let patterns suggest the answer. Useful when nobody knows where to look; slow when the data is large.
Design thinking: as much effort reframing the problem as solving it, with the people who live it. Useful when the problem itself is unclear.
Engineering approach: frame once, then ship many small fixes and learn from each. Useful when changes are cheap and easy to reverse.
Four checks for a good hypothesis.
Specific. It names the mechanism ("the first rule drains the pool"), not the area ("the rules are wrong").
Falsifiable. You can describe, in advance, the result that would kill it.
Tied to the decision. If it is true, the owner would act differently.
Testable now. The data and the access to test it exist this week, not next quarter.
How to write one. Start from the key question and ask what would have to be true for the problem to happen. Write each answer as one sentence that names a cause. Group the sentences until each level is MECE, then attach to each one the test that would disprove it.
At the bank, the tree had three branches:
H1 · The data is missing. The drivers that should split cost by channel or branch were never loaded at that level of detail.
H2 · The rules are competing. Several allocation rules draw from the same cost pool, and the first one to run takes everything.
H3 · The view is lying. Cost is there, but the reporting or balancing screen cannot see it.
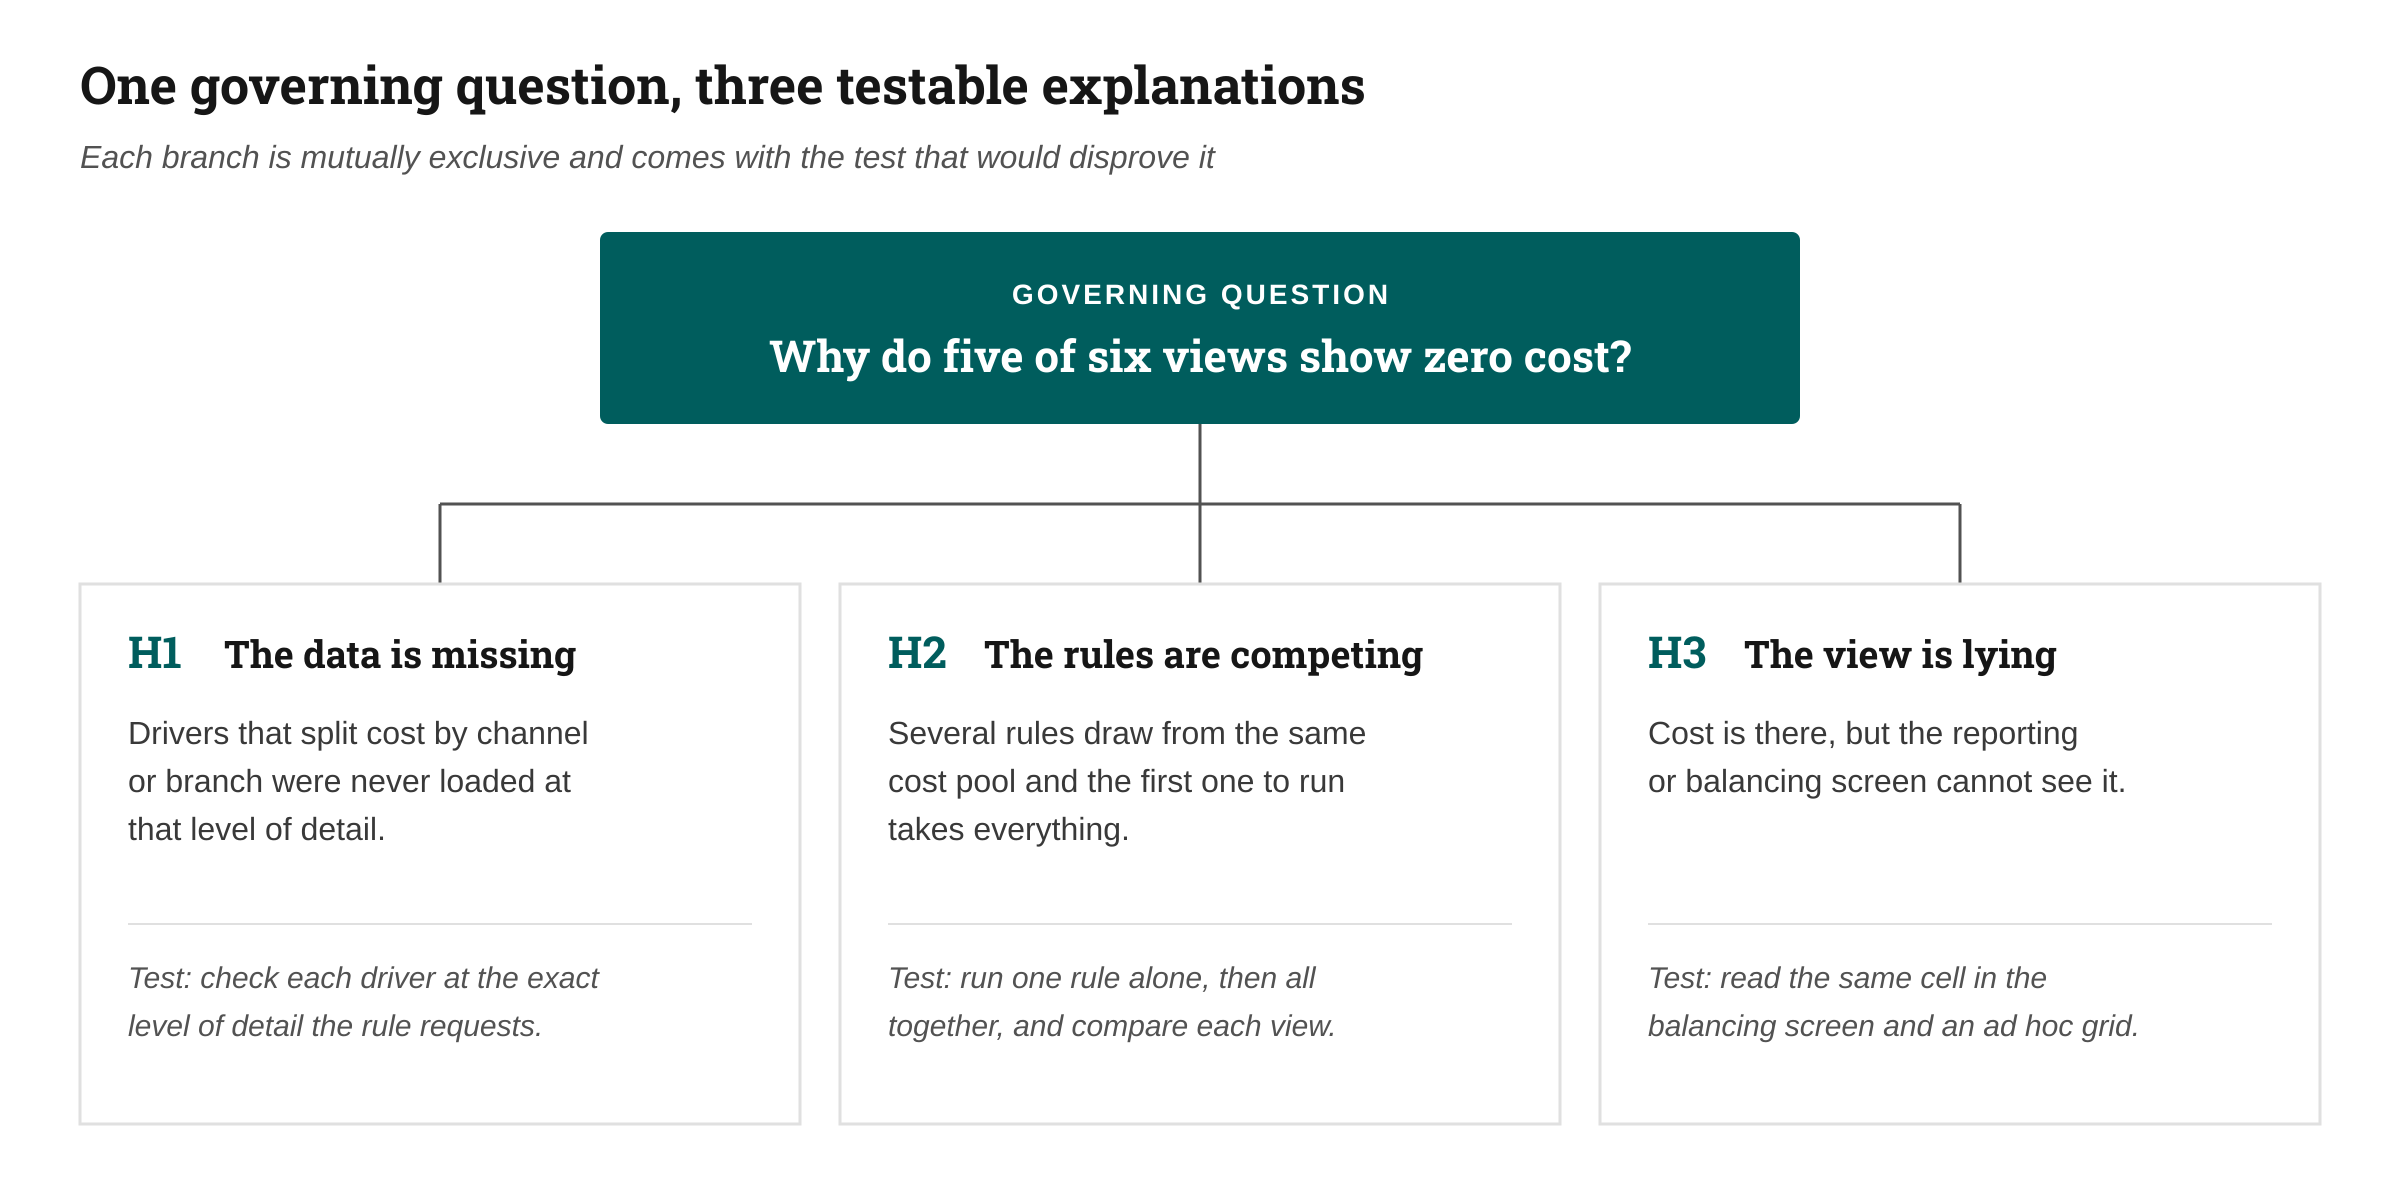
Figure 2. Hypothesis tree: three mutually exclusive explanations, each with the test that would disprove it.
Step 3 · Prioritize by impact and ease of testing
Not every hypothesis deserves the same effort. Plot each one on a two-by-two: impact on the decision on one axis, ease of proving or disproving it on the other. Start in the top-right corner: high impact, cheap to test.
The classic version of this matrix uses ease of implementation. For diagnosis we use ease of testing, because the first job is to eliminate wrong explanations fast.
At the bank, H1 looked most likely, but testing it meant waiting on the bank's data teams. H2 could be tested in a single controlled run. H2 went first.
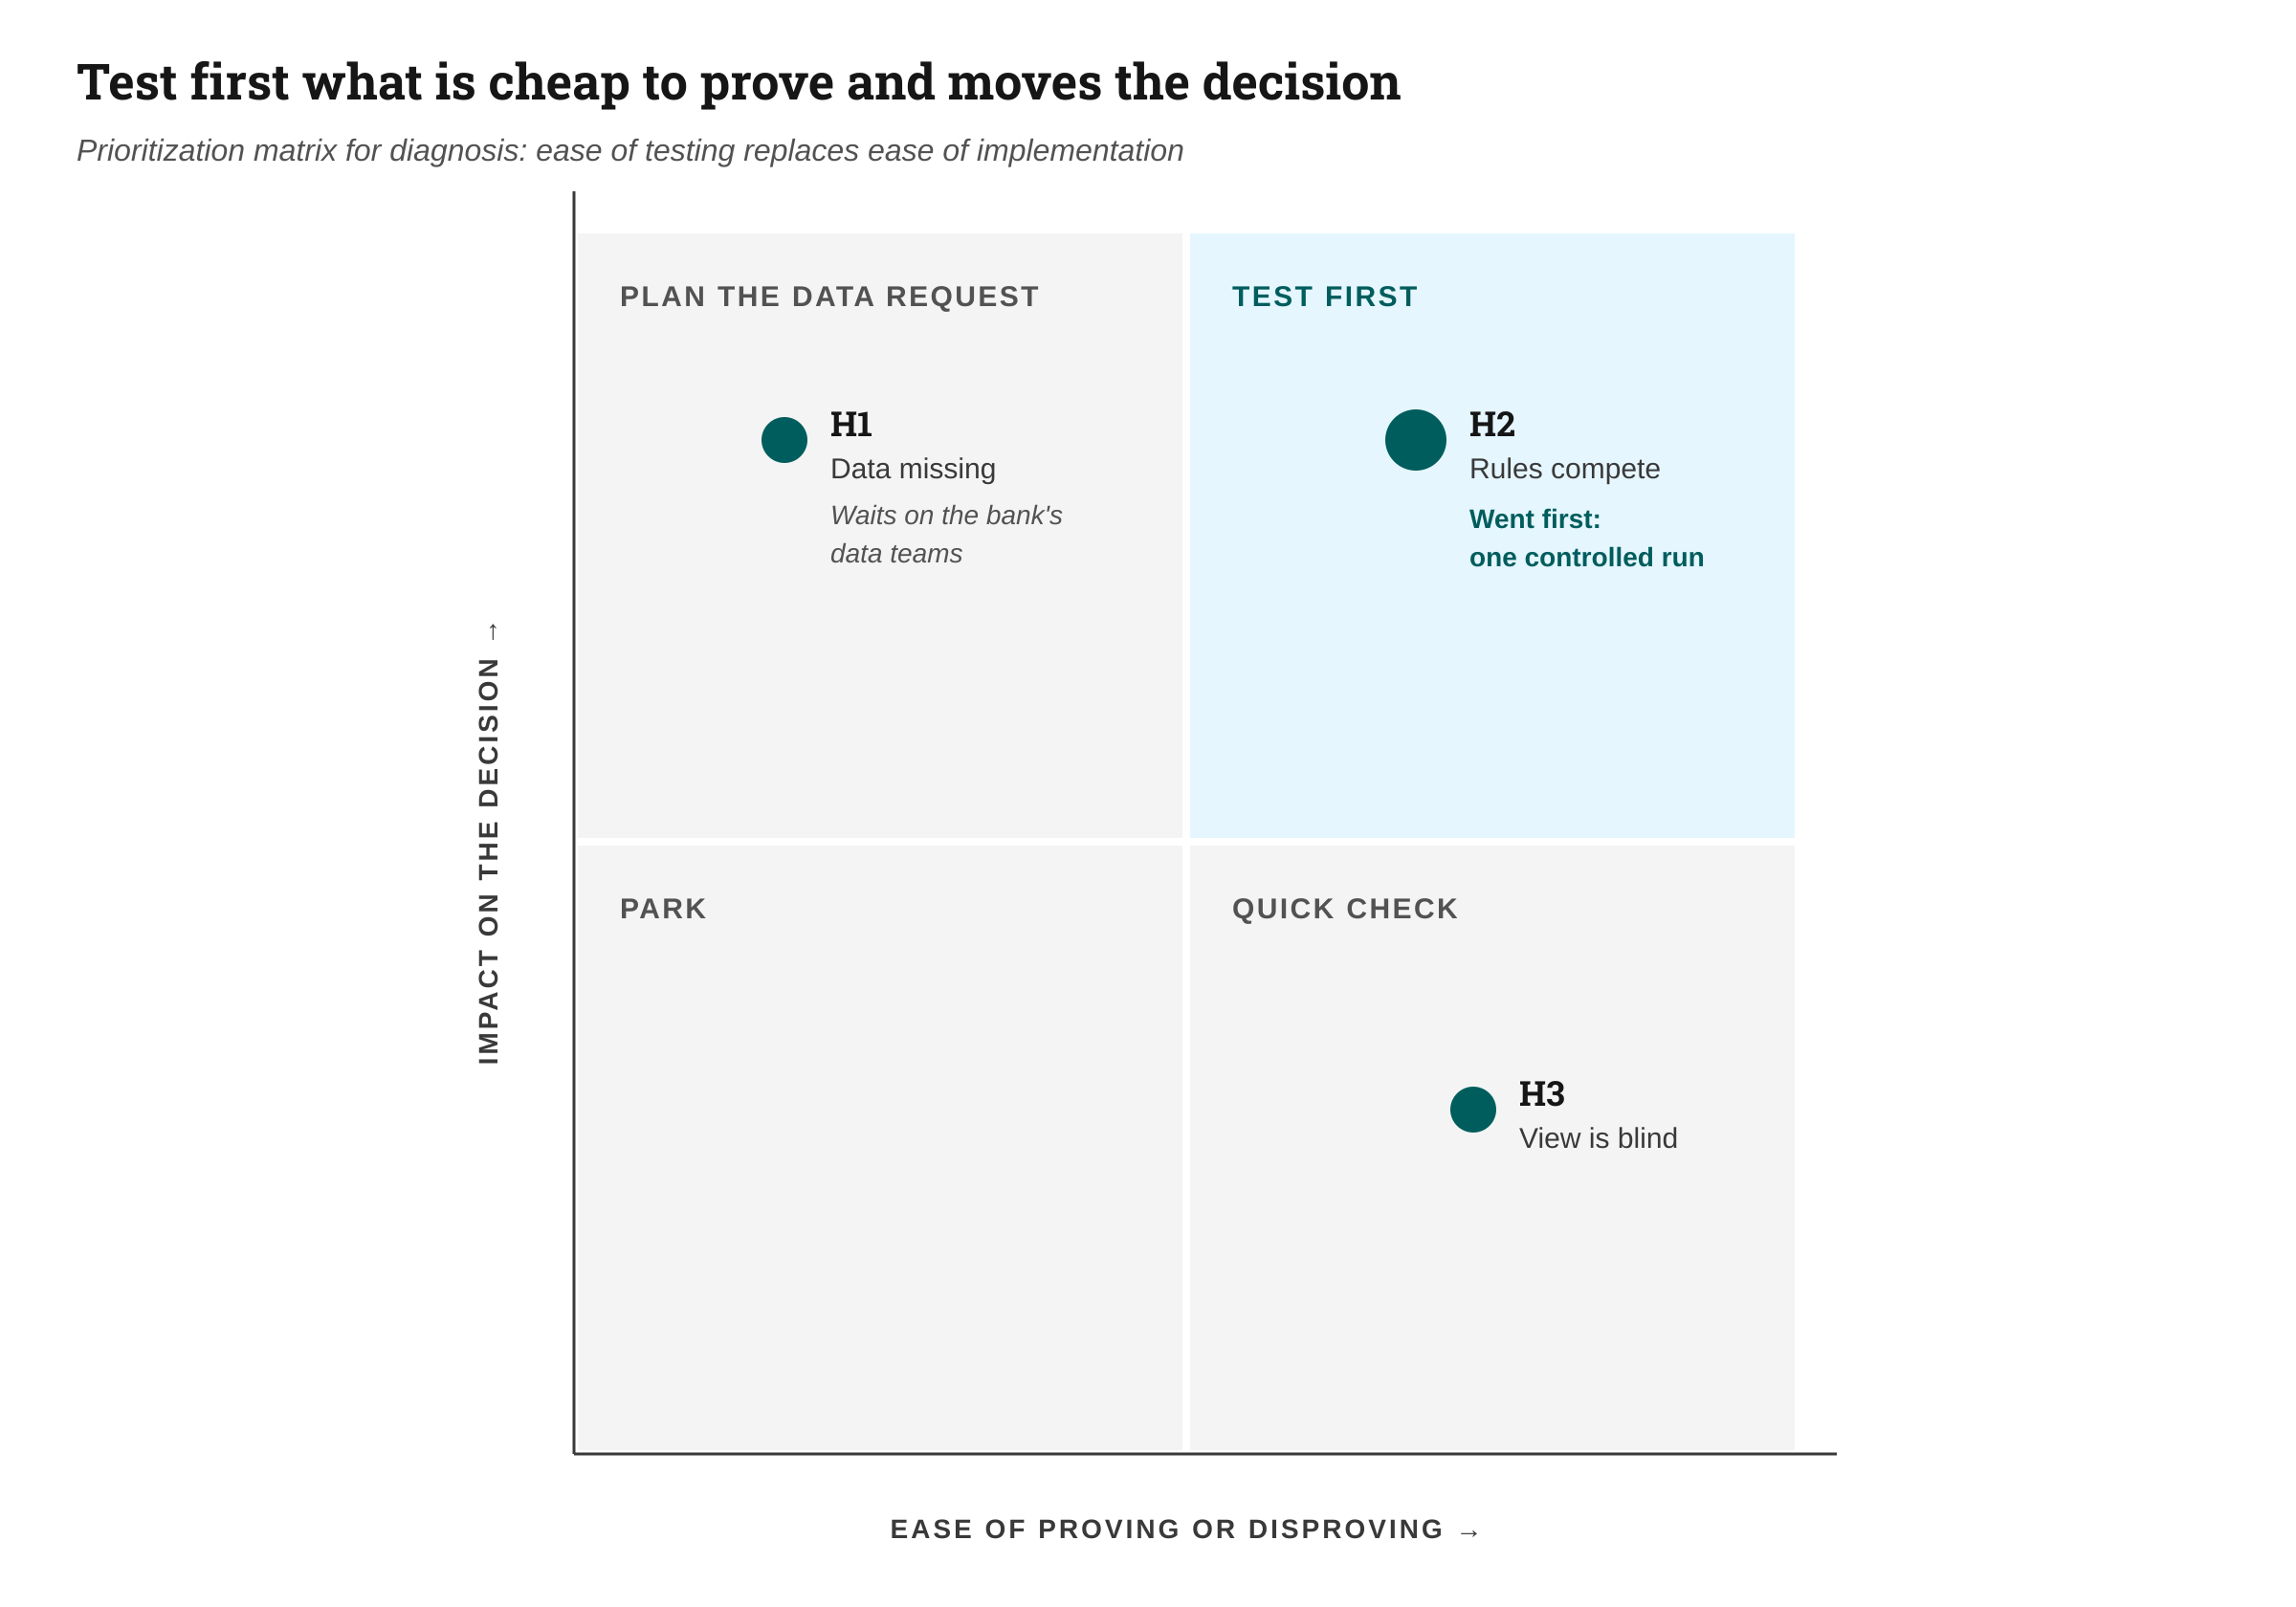
Figure 3. Prioritization matrix: H2 had high impact and could be tested in one run, so it went first.
Step 4 · Build a work plan around the tests
For each priority hypothesis, write one line: the analysis that would disprove it, the data it needs and where that data lives, who runs it, and by when. If an analysis cannot change the decision either way, it does not go on the plan.
H2 · Rules compete. Test: run one reporting rule alone, then all together, and compare the result in each view. Data: live calculation, sandbox version. Owner: model architect. Due: day 2.
H3 · View is blind. Test: read the same cell in the balancing screen and in an ad hoc grid. Data: live system. Owner: model architect. Due: day 2.
H1 · Data missing. Test: check each driver at the exact level of detail the rule requests. Data: driver load files and live system. Owner: bank data team. Due: day 5.
Field note: the plan names a sandbox version on purpose. Diagnosis never runs on the numbers the business is reading.
Step 5 · Run the smallest test that can kill a hypothesis
The goal of analysis here is elimination. Design each test so that one clean result rules an explanation in or out. Apply the 80/20 rule: the first fifth of the work usually tells you which way the answer falls.
Two rules we learned the hard way:
Read the live system, not the logbook. A status note says how things were the day it was written. A green job can still write zero.
Distrust the green light. A run that finishes without errors proves the engine ran, not that the numbers are right.
At the bank, the H2 test took one run. With a single reporting rule enabled, cost reached its view in full. With all six enabled, the first rule drained the pool and the other five wrote zeros. H2 confirmed. H1 was still true for some views, but it was not the cause of the zeros.
Step 6 · Synthesize into one governing thought
Findings are not an answer until they are synthesized. We use the Pyramid Principle: one governing thought at the top, three or so supporting arguments beneath it, the evidence under each.
The bank's governing thought fit in one sentence: the reporting views are empty because the rules compete for one cost pool, so the fix is to run each view on its own, and the data request can wait.
Synthesize as you go, not at the end. After every test, rewrite the top of the pyramid. If it does not change, you are probably testing things that do not matter.
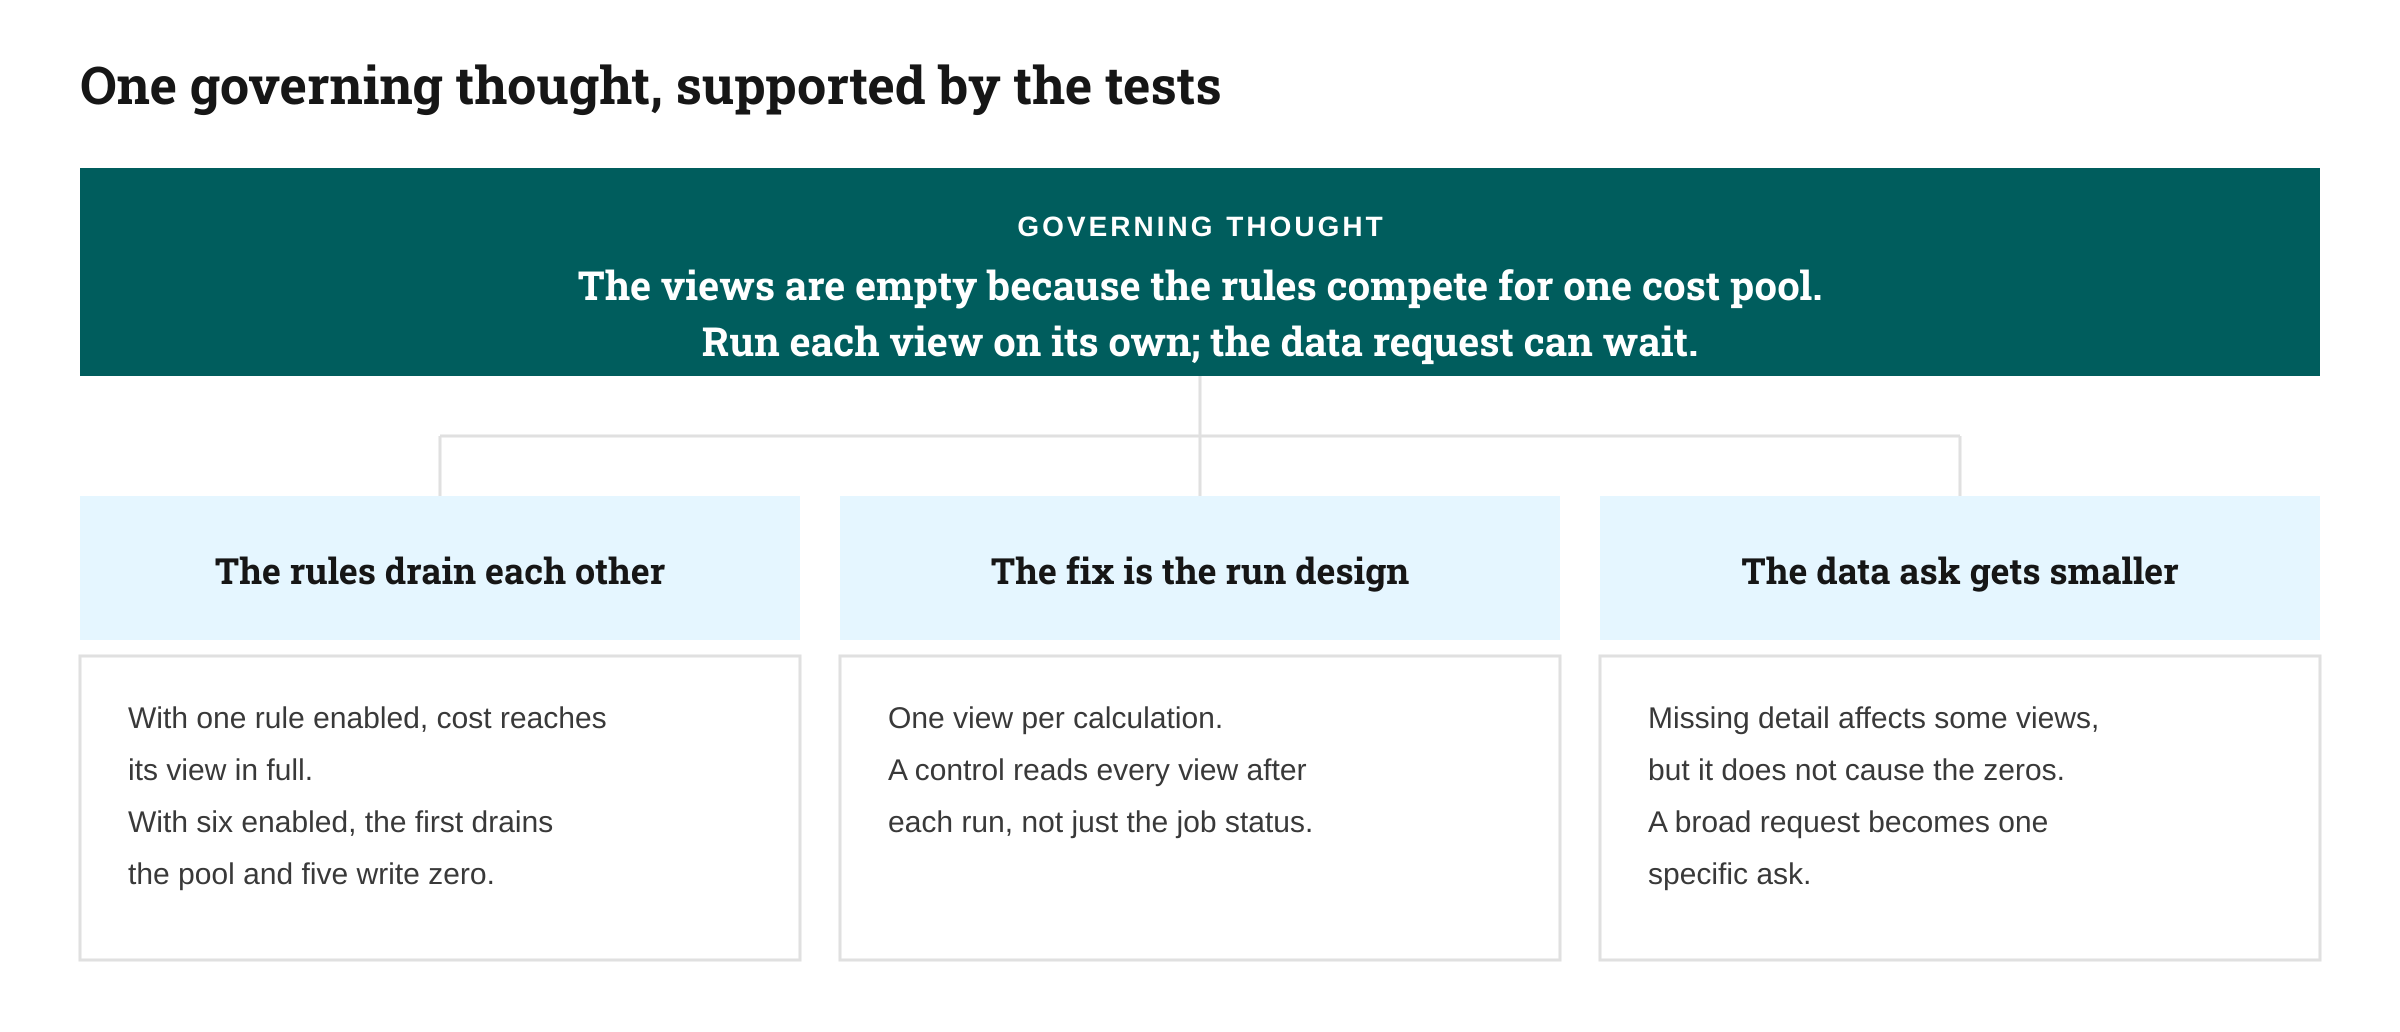
Figure 4. Pyramid: one governing thought, three supporting arguments, the evidence under each.
Step 7 · Recommend in a form the owner can act on
A recommendation is an action plan: what changes, who owns it, by when, what success looks like, and what could get in the way. Tell it with Situation, Complication, Resolution:
Situation: the model reconciles every month and the CFO needs cost to serve by channel and branch.
Complication: five of six views show zero because the rules drain each other, silently.
Resolution: run one view per calculation, add a control that reads each view after every run, and send the bank one targeted data request instead of a general one.
The decision owner signed off on the run design in one meeting. The broad data request the team had been drafting for weeks became a single, specific ask.
Where Decision-to-Value™ fits
The seven steps are a thinking discipline. Our Decision-to-Value™ method adds the part most problem-solving guides skip: it ties every hypothesis to the decision it informs and to the cost and profitability data that can prove it.
In practice that means three things:
Every hypothesis tree starts from a named decision and its owner, never from a data set.
Every test is designed against the model's real data, at the exact level of detail the decision needs.
Every recommendation states what value moves, in money, if the owner acts.
Three questions for your next decision
Can you state, in one sentence, the decision your current analysis is meant to inform, and who will make it?
For the explanation your team believes most, what single test would prove it wrong, and has anyone run it?
When your last model run finished green, did anyone check that every view actually received its numbers?
Pedro San Martín is Principal at Asher & Company and architect of the Decision-to-Value™ framework. He works with CFOs and finance leaders to connect EPM technology to decisions that move enterprise value.
