

Price every kilowatt with the cost behind it.
Energy, cooling, M&E, capex and people, traced from the general ledger to each hall, rack, service and customer. Built on Oracle EPCM, so your finance and operations teams run it after go-live.
The cost of a data center is invisible where decisions are made
Operators measure PUE and uptime with precision, then price capacity with a market number and a spreadsheet.
Opaque cost
Energy, capex and O&M are never tied to services or customers.
Idle capacity hides
Megawatts built but not sold disappear into the average cost instead of showing as a cost of their own.
Price without a floor
The $/kW comes from the market, with no incremental cost to defend it in a negotiation.
KPIs without a P&L
PUE and availability are tracked, but never translated into margin or return on capital.
Hybrid without one view
On-prem runs on IT financial management and cloud on FinOps, each with its own numbers.
Price, capacity and capex should be decided with the same number.
One cost and value model, layer by layer, from the invoice to the customer
Each step is a set of allocation rules with its own driver. The last step turns cost into rates and KPIs.
ROIC value tree
A handful of KPIs, each traceable to margin or invested capital: capacity sold, energy cost per kWh and capex per MW.
LRIC+ pricing
Long-run incremental cost as the price floor per MW and per rack; stand-alone cost as the ceiling.
Showback and chargeback
Cost per service and per customer, with the kilowatt as the main driver, for enterprise and colocation alike.
The model already runs in Oracle EPCM
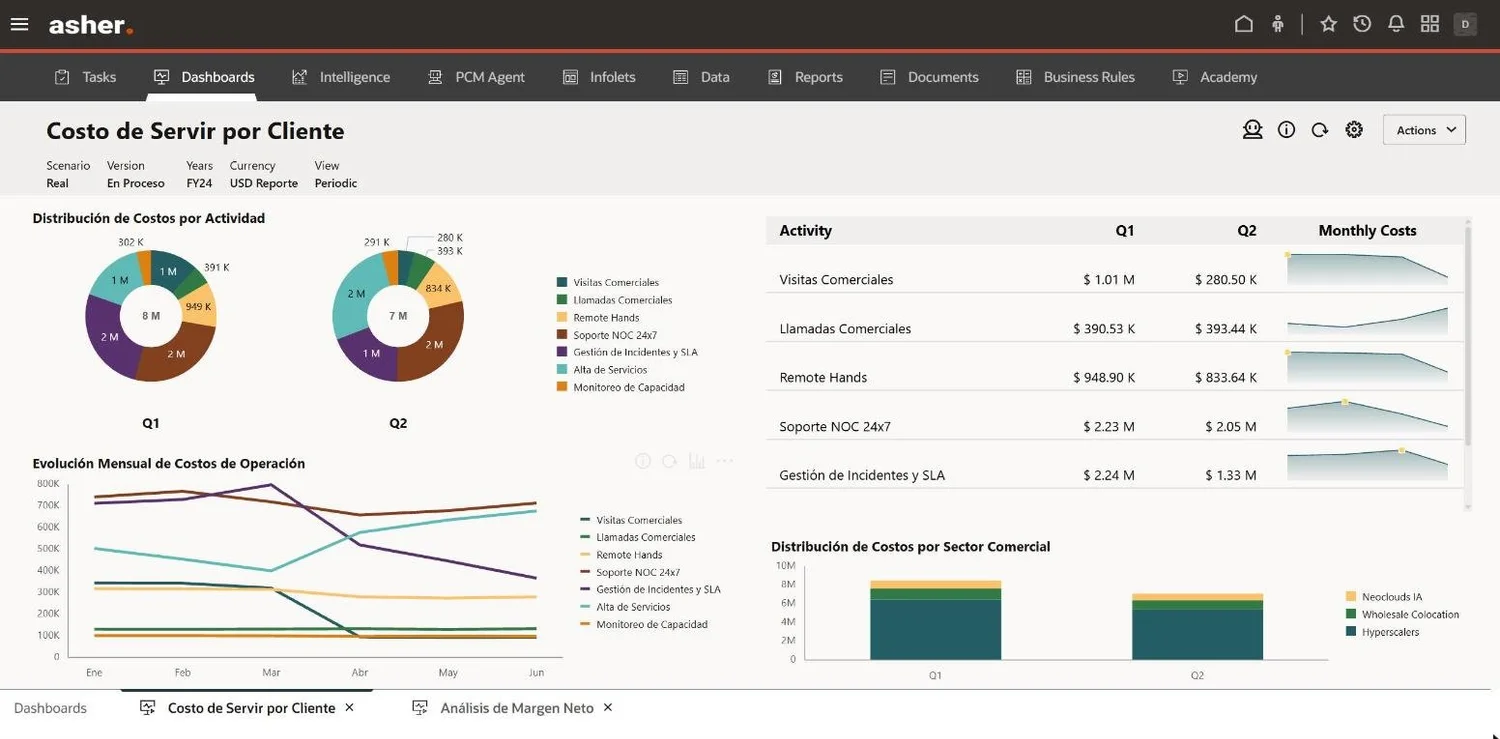
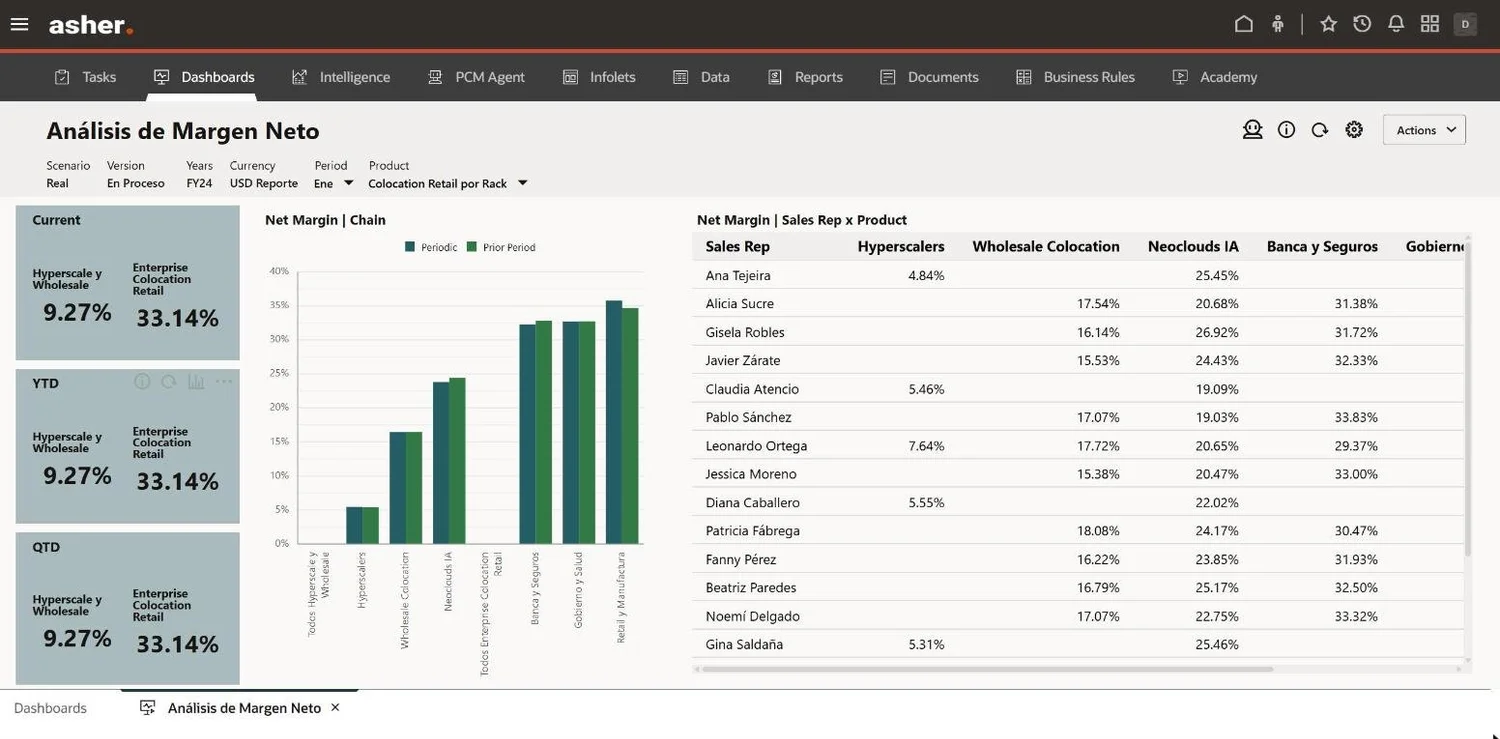
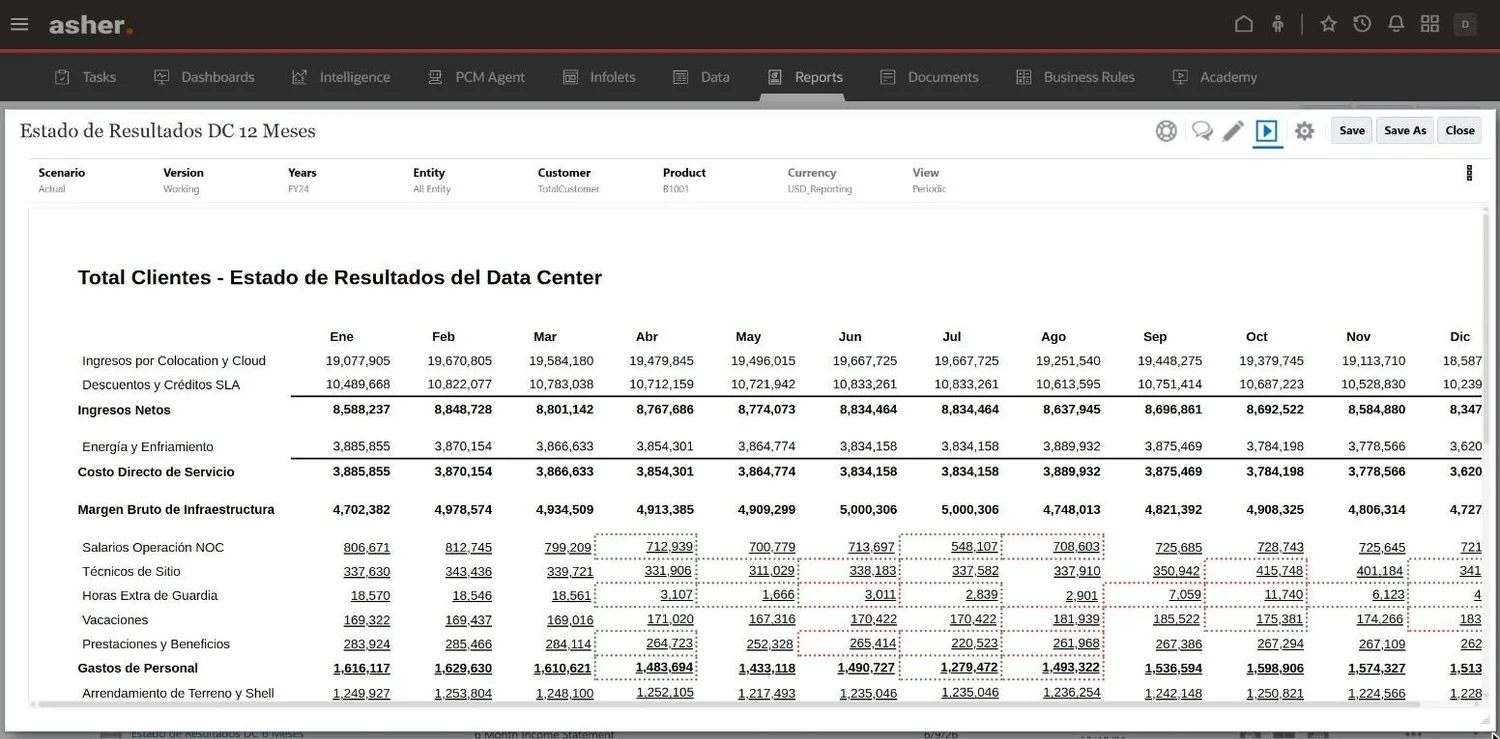
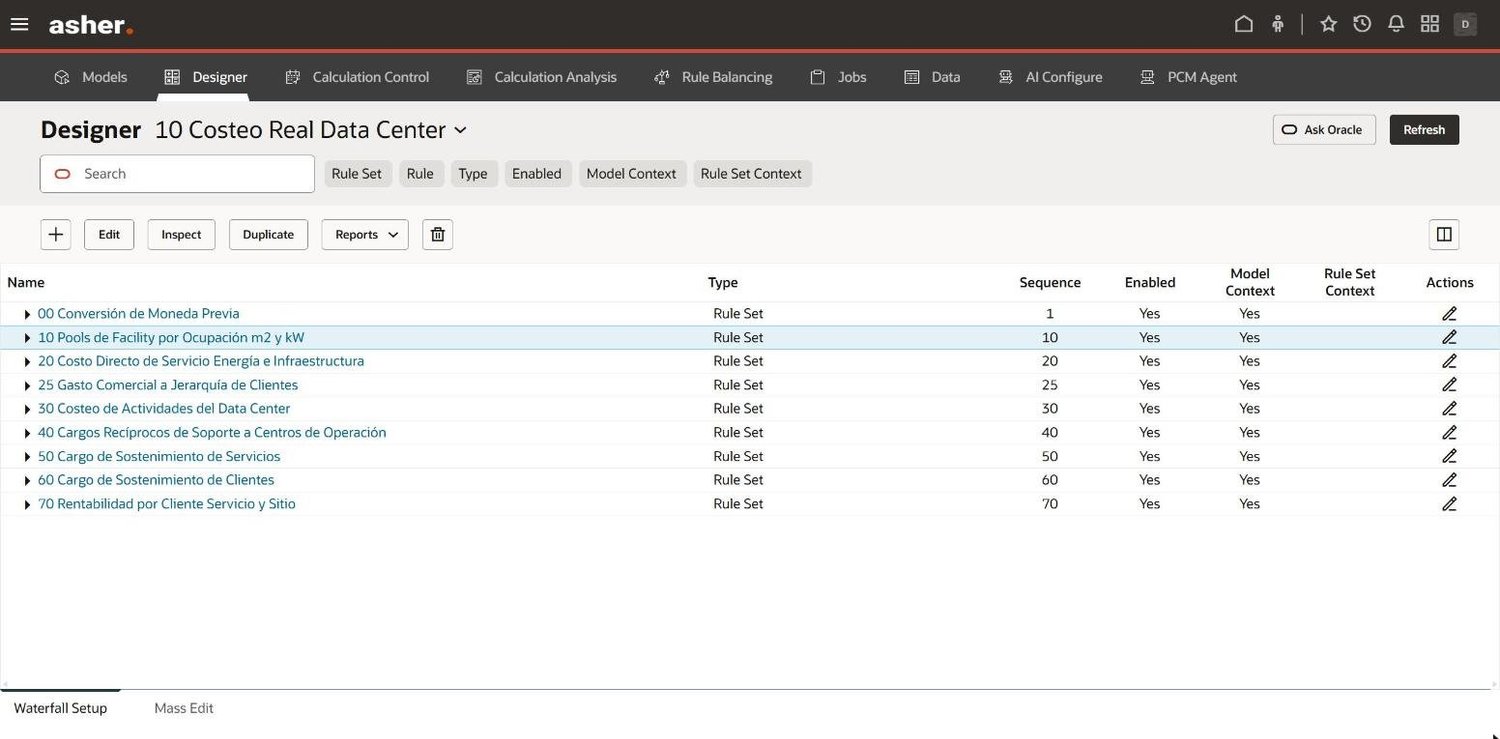
Screens from our data center demo environment: the same rule cascade, reports and dashboards we adapt to each operator. Figures are sample data, not a client's.
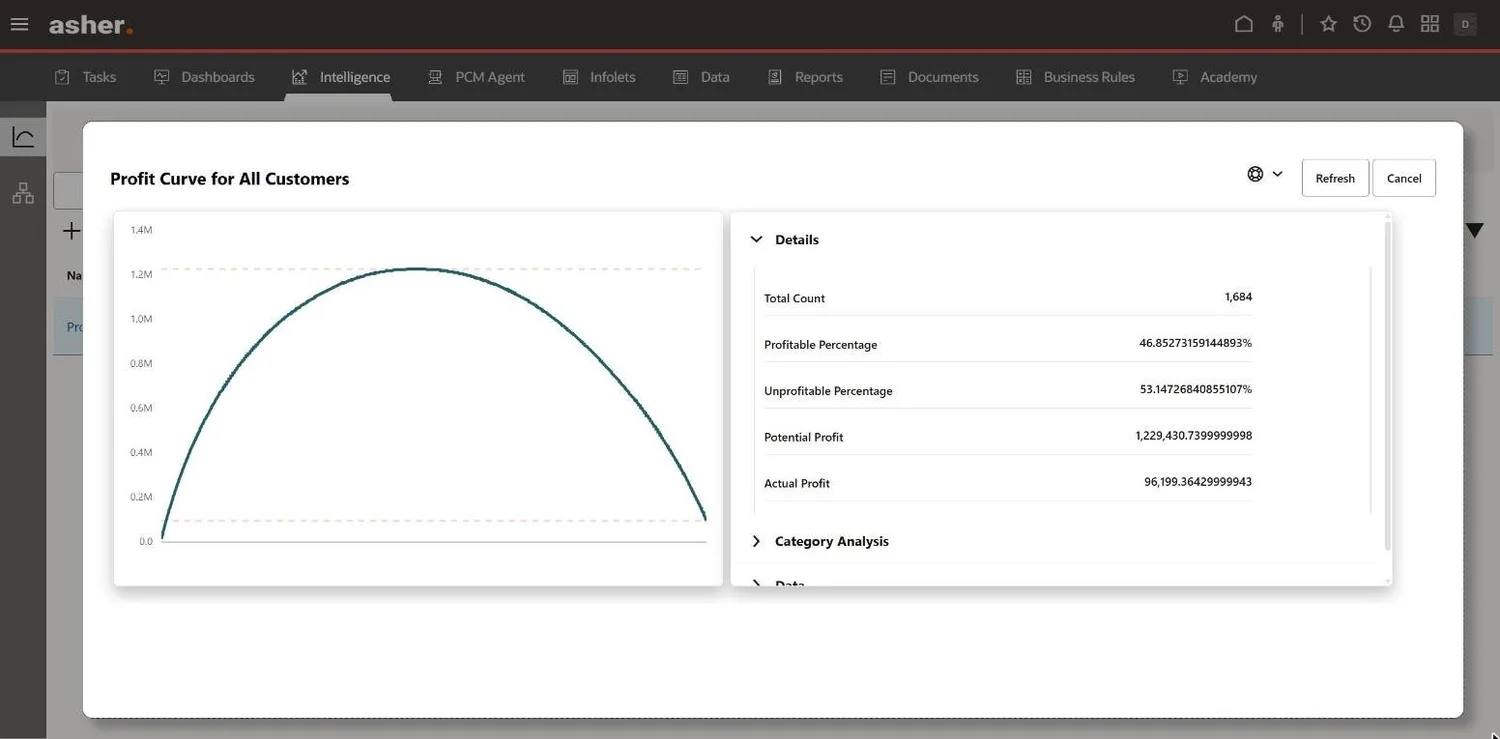
Ask the model in plain language
Oracle EPCM ships AI inside the modeling screens: list and change rules, find which rules depend on a driver such as metered kW, and run calculations by asking. Our StrategicFinance.ai™ agents work on top of the same model.
- Ask Oracle inside Designer and Calculation Control
- Impact analysis of a driver change, in seconds
- Agents for planning, profitability and narrative
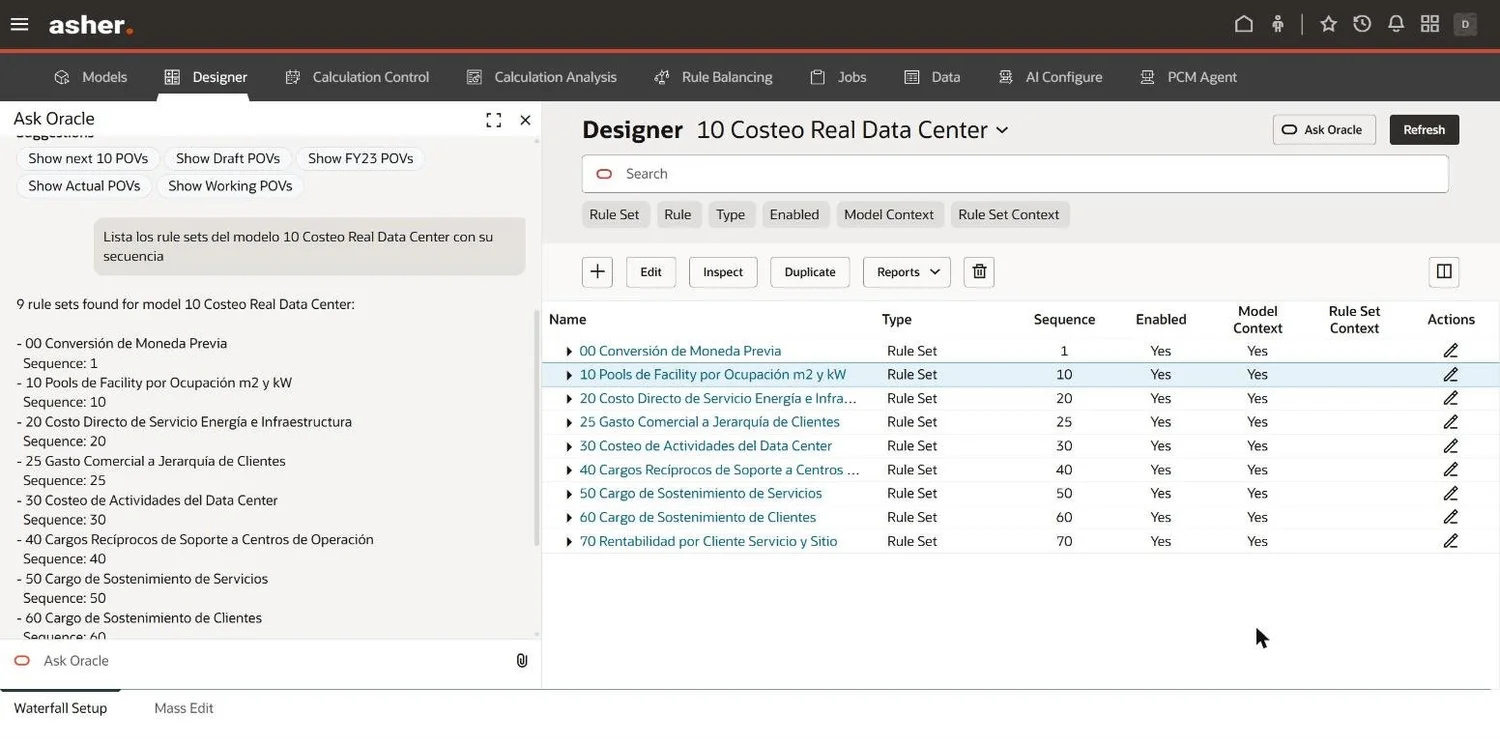
Every type of data center recovers its cost with a different driver
Enterprise and on-prem
A cost center recovered through showback or chargeback.
Retail colocation
Racks and cages for many tenants; charges kW, space and interconnection.
Wholesale colocation
Whole halls or MW on long contracts, with real-estate style margins.
Cloud and hyperscale
Massive campuses at the lowest unit cost, sold as cloud services.
Edge
Small sites close to users, where scale is the cost problem.
AI factories
High-density GPU racks with liquid cooling, run by neoclouds and hyperscalers.
Start small. Prove it. Then build.
Cost benchmark
Where your cost per kW stands, which data you already have and what is missing.
Decision sizing workshop
Finance and operations agree on the decisions the model must support: price, capacity, capex.
Rapid deployment
The model in Oracle EPCM with your GL, DCIM and contracts, handed over to your team.
See your data center in the model
A 45-minute walkthrough of the demo, adapted to your type of facility.