

The Megawatt Is the New Lease: How to Keep the Data Center Race from Destroying Value
North America has almost no data center space left to rent. CBRE put vacancy in the primary markets at 1.4% in the first half of 2026, a record low, with 80% of the capacity under construction already preleased. Meanwhile, the four largest hyperscalers are guiding to roughly $700 billion of capital spending this year. Bain estimates that by 2030 AI will still be about $800 billion a year short of the revenue it needs to pay for its compute.
Demand is real. Whether it pays back is still an open question.
I have spent thirty years building cost and profitability models, mostly for banks. Recently I applied the same discipline to data centers and built a costing model in Oracle EPCM to test the logic. The industry is building at record speed, and that part is hard enough. Getting paid back depends on how many megawatts you commit, what you charge for them and how fast you fill them.
I write this for the CFO of a colocation or wholesale operator. Enterprise data centers and GPU clouds can apply it with a different unit, a chargeback rate or a GPU-hour. I flag where that changes the answer.
Power now comes with a fixed commitment
For most of the industry's history, the power bill moved with the load. Fewer servers meant a smaller bill. The energy part of the bill still works like that. The capacity part increasingly doesn't.
Utilities now make large loads pay for contracted capacity whether they use it or not. In August 2026, Lawrence Berkeley National Laboratory and Brattle reviewed 55 large-load tariffs in the US. The median minimum billing demand is 80% of contracted demand. The median contract term went from 5 years, for tariffs proposed before 2025, to 12 years for those proposed since.
Two cases show what that looks like.
AEP Ohio's data center tariff, approved in July 2025, covers new loads above 25 MW for up to 12 years, including a ramp period. The minimum billing demand follows a published schedule. Above 75 MW, it is 57.5 MW plus 100% of the capacity over 75 MW, capped at 85% of the contract. Depending on the customer's credit and liquidity, the utility can also require collateral of up to half the minimum charges over the term.
Dominion's new GS-5 class in Virginia, approved in November 2025 and effective in January 2027, asks for a 14-year contract. Minimum charges are 85% on distribution and transmission and 60% on generation, with collateral of $1.5 million per contracted megawatt.
Apply the Ohio schedule to a 100 MW contract and the minimum billing demand comes out at 82.5 MW (57.5 plus 25). If the campus ramps to 50 MW of real load, you are billed demand charges on 32.5 MW you are not using. You don't pay for energy you don't draw, so nothing is wasted at the meter. What you pay for is idle capacity, and it now arrives with an invoice. Its size depends on the demand rate, so it has to be calculated in the model.
PJM's capacity market tells a similar story. The clearing price went from $28.92 per MW-day for 2024/25 to $269.92 the next year. Then it hit the price cap three auctions in a row, between $325 and $333. PJM's market monitor attributed about 40% of the cost of the 2027/28 auction, $6.5 billion out of $16.4 billion, to data center load.
In practice a contracted megawatt behaves like a lease, and it should get a lease-style review before anyone signs.
Five different megawatts
Part of the problem is vocabulary. In a typical capacity meeting the word "megawatt" covers at least five different things.
Grid connection MW, contracted with the utility and billed under its minimums.
IT load MW, the critical capacity the building was designed to deliver.
Sellable MW, what is left after the redundancy and technical reserve the service needs.
Sold MW, contracted by customers.
Consumed MW, what customers actually draw.
"Utilization" can mean the ratio between any two of them. Agree which ratio you mean before anyone argues about it. The gap between grid connection and sold capacity is your idle capacity cost. The gap between sold and consumed is a pricing and contract question.
Three clocks inside one building
On the balance sheet a data center looks like one asset. It is three, and each one ages at its own speed. The shell lasts twenty years or more. The power and cooling plant lasts ten to fifteen. The IT layer, and especially the GPUs, lasts two to six years, depending on whom you ask.
That last number moves earnings. Alphabet's 10-K says that moving server lives from four to six years cut depreciation by $3.9 billion. Amazon went the other way in 2025 and shortened part of its fleet from six years to five, citing the pace of AI.
For a colocation operator, the GPUs belong to the customer. The obsolescence risk still reaches you through density. A hall designed for 10 to 20 kW racks has a problem when the next customer shows up with 100 kW racks and liquid cooling. Either it gets a retrofit or it gets stranded. Pricing that risk into the contract costs far less than an engineering fix later.
Battlefield lessons: China and the telecom bust
China gives us a clear recent warning about demand, location and execution.
More than 500 "intelligent computing" projects were announced in 2023 and 2024, many with local government backing. MIT Technology Review reported in March 2025 that up to 80% of newly built computing capacity sat unused, citing Chinese industry outlets. A few months later Reuters quoted four sources who put utilization at around 20% to 30%. Only 11 data center projects were cancelled in 2023. More than 100 were cancelled over the following 18 months. Many of these centers were built in the west of the country, far from the users who needed low-latency inference. Some owners kept facilities dark because running a small part of the center would not cover electricity and maintenance.
Beijing has since tightened the rules. The NDRC now asks for a computing-power purchase agreement and a minimum utilization ratio before it approves a project.
The US has its own precedent. In July 2002, FCC Chairman Michael Powell told the Senate that the telecom industry owed about $1 trillion, much of which would never be repaid. The fiber itself found a use, carrying broadband and later the cloud. Most of the money that paid for it never came back.
I don't expect a crash. With vacancy at 1.4% there is no glut today. Absorption happens one hall at a time, though, and a national story about AI demand will not sign the lease on a hall in a particular county under a particular utility contract.
From megawatt to return on capital
The listed operators show where returns come from. Equinix reports about a 27% cash return on gross PP&E for 187 stabilized data centers that are 82% utilized, with a 49% adjusted EBITDA margin for 2025. Digital Realty says utilities are its largest expense, about 23% of revenue, and that tenants reimbursed around 88% of it. In both companies utilization, price and pass-through work together. Equinix's figure is a cash return on gross assets rather than ROIC, yet the message holds. Returns follow how full the building is and how the contracts are written.
The value tree I use links those pieces in a chain.
Sellable capacity → capacity sold to customers → revenue and contribution per customer → operating result → return on invested capital.
Each link has its own measures. Sellable MW and the share of it that is sold. Revenue per kW-month by customer. The share of power cost passed through. PUE, still 1.54 on average according to the Uptime Institute, flat for six years. SLA credits and outages, where 54% of operators in Uptime's survey said their last significant outage cost more than $100,000. Depreciation by layer. And on the capital side, build cost per MW, which Cushman & Wakefield puts at $17.6 million on average in 2026 before chips, plus any collateral you post to the utility.
One warning on collateral. The cash you post is invested capital. Future minimum payments are committed cash flows, and they should be modeled that way instead of being added to the capital base a second time.
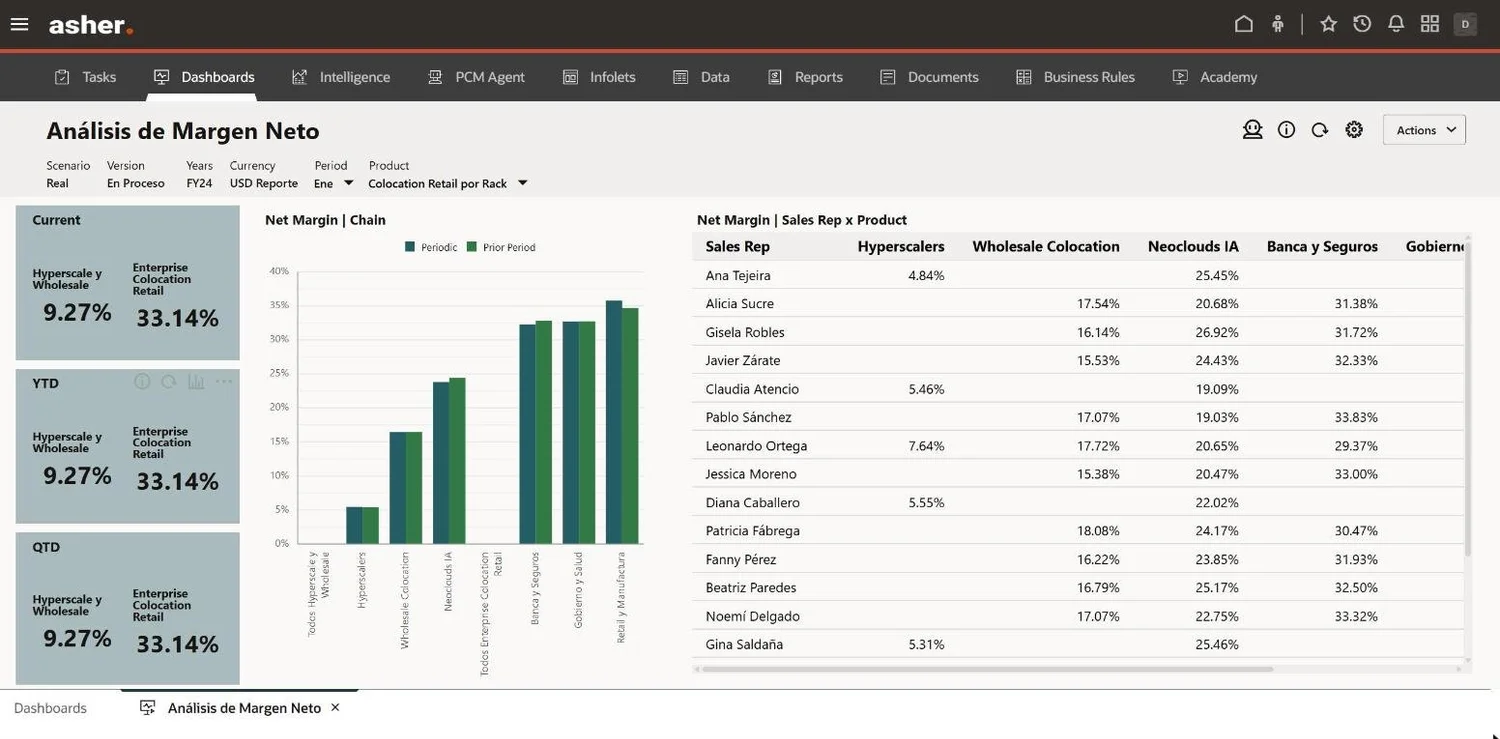
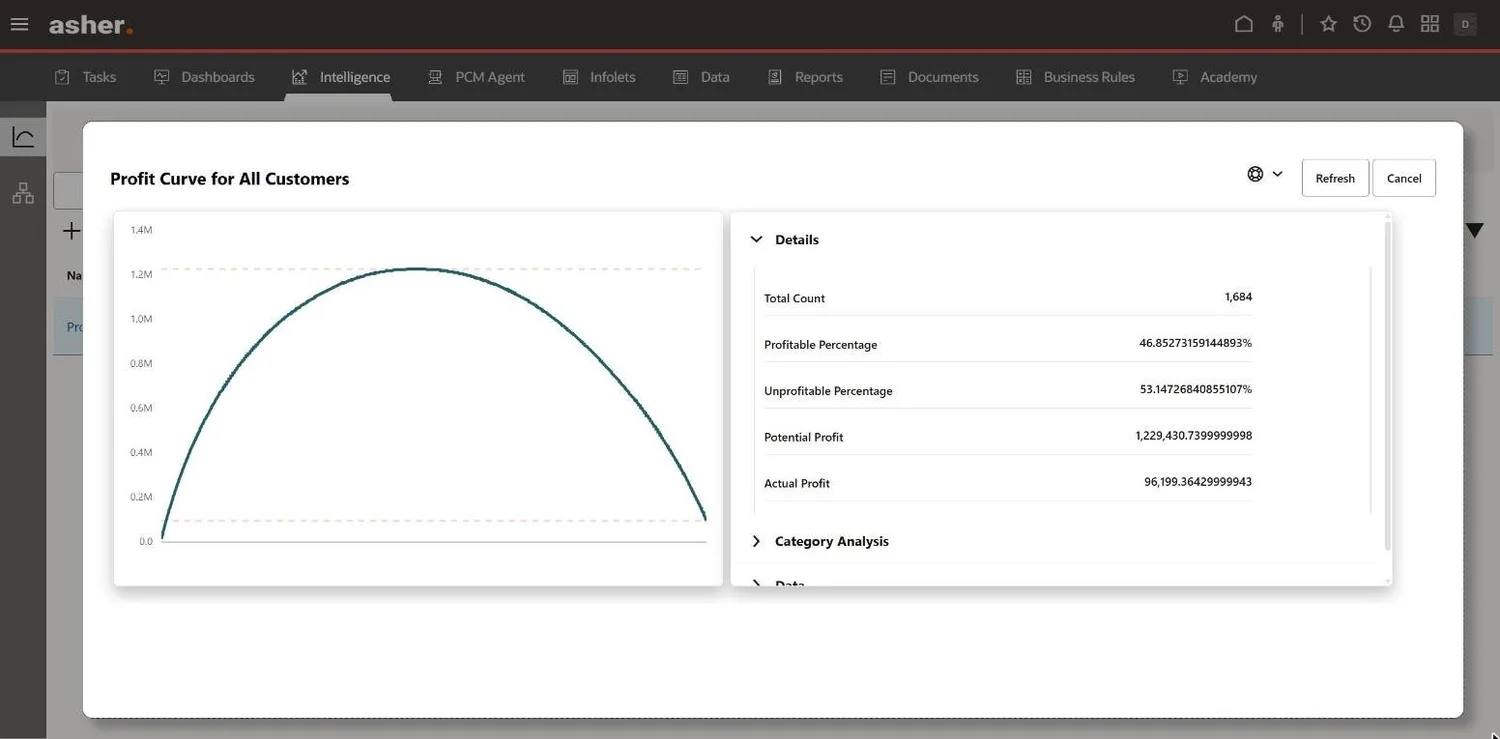
The chain also runs down to each customer, and this is where a costing model starts to pay for itself. In our demo, with sample data, hyperscale and wholesale customers earn a 9.3% net margin against 33.1% for enterprise retail. The biggest logos fill the halls while earning the thinnest margin in the building. The profit curve in the same demo shows 53% of 1,684 customers losing money. The figures are illustrative. Neither pattern shows up in a utilization report; you need cost assigned contract by contract to see it.
A worked example: one hall, three decisions
To make this concrete, take an illustrative case. The numbers are round, built from public cost benchmarks, and they do not describe market rents or any client.
An operator has just finished a 20 MW hall. After redundancy and technical reserve, 18 MW is sellable. The full monthly cost of the hall, before energy, which is passed through, looks like this per built kW:
Facility capital at $17.6 million per MW, recovered over 20 years at an 8% cost of capital: $149.
Power reservation, the demand charges billed with or without load: $15.
Utility collateral of $1.5 million per MW, carried at 8%: $10.
Fixed O&M, including staff, maintenance, insurance and property tax: $20.
Together that is $194 per built kW, or $216 per sellable kW at 90% practical capacity. Across the hall, the full monthly cost is about $3.89 million.
Decision one: what does the ramp cost? In year one the operator sells 9 MW at $230 per kW-month. Revenue is $2.07 million a month, which covers 53% of the hall's full cost. The other 9 MW of sellable capacity sits idle. At $216 each, that is about $1.9 million a month of idle capacity cost, and somebody should own that number.
Decision two: what if a customer pays a reservation? A customer reserves 6 MW for the following year and pays half the rate, $108 per kW-month, until it moves in. That brings in $648,000 a month and lifts coverage to 70%. A reservation fee is a simple way to share ramp risk with the customer whose move-in date drives it.
Decision three: should we take a 4 MW contract at $170? It is below the $216 floor. For capacity that is already built and committed, the relevant cost is the short-run incremental one, here about $12 per kW-month of variable cost. At $170 each kilowatt contributes $158 a month to costs that are already sunk. Coverage rises to about 86%. Take the contract, as long as it does not block a better customer.
But the same $170 cannot justify building the next hall. For new capacity the floor is the full $216. Accepting demand for existing capacity and approving an expansion are two different decisions, and they need two different prices.
At $230 and fully sold, the hall clears its 8% cost of capital. Every month spent below full occupancy, and every contract below $216 used to justify new construction, eats into that return.
Strategic cost management is the control system
None of these tools is new. They come from manufacturing cost accounting and from telecom regulation, and they carry over to a data center with little adaptation.
Practical capacity. Time-driven activity-based costing, from Robert Kaplan and Steven Anderson, costs resources at practical capacity instead of at whatever volume happened to run. In the example above, that is why the rate is $216 per sellable kW and the unsold part shows up on its own line. Idle capacity stops hiding inside the average cost of everyone else's racks.
Three kinds of capacity, one owner each. Separate service capacity, including the redundancy customers pay for as part of availability, from technical reserve and from unsold commercial capacity. The CAM-I capacity model gives you a vocabulary for this. Only the third one is idle in the commercial sense, and it needs a name next to it.
Two price floors. Long-run incremental cost, which telecom regulators have used for decades, is the floor for new capacity. It should include the power reservation, the collateral, the shell, the M&E plant and an allowance for obsolescence. Short-run incremental cost is the floor for selling capacity you already have. Mixing the two leads either to turning away good contracts or to building halls that never pay back.
Depreciation by layer. Book what your auditors accept. If you own IT equipment, run the business case and the covenants on a shorter life as well, and see what still holds.
Matching terms. If the utility holds you to 85% for 14 years, a five-year customer contract without pass-through or reservation fees is a mismatch you are financing yourself.
A checklist for the CFO
Define the five megawatts and use one definition of utilization per decision.
Cost capacity at practical capacity, and report unsold commercial capacity as a named line with an owner.
Model contracted utility minimums as committed cash flows, and count posted collateral as invested capital.
Use LRIC to approve new capacity and short-run incremental cost to accept demand for existing capacity.
Share ramp risk through reservation fees and minimum commitments.
Match customer tenor and pass-through to your utility obligations.
Run the whole chain in one driver-based model, so a capacity decision is tested against value before anyone signs.
How I approach it
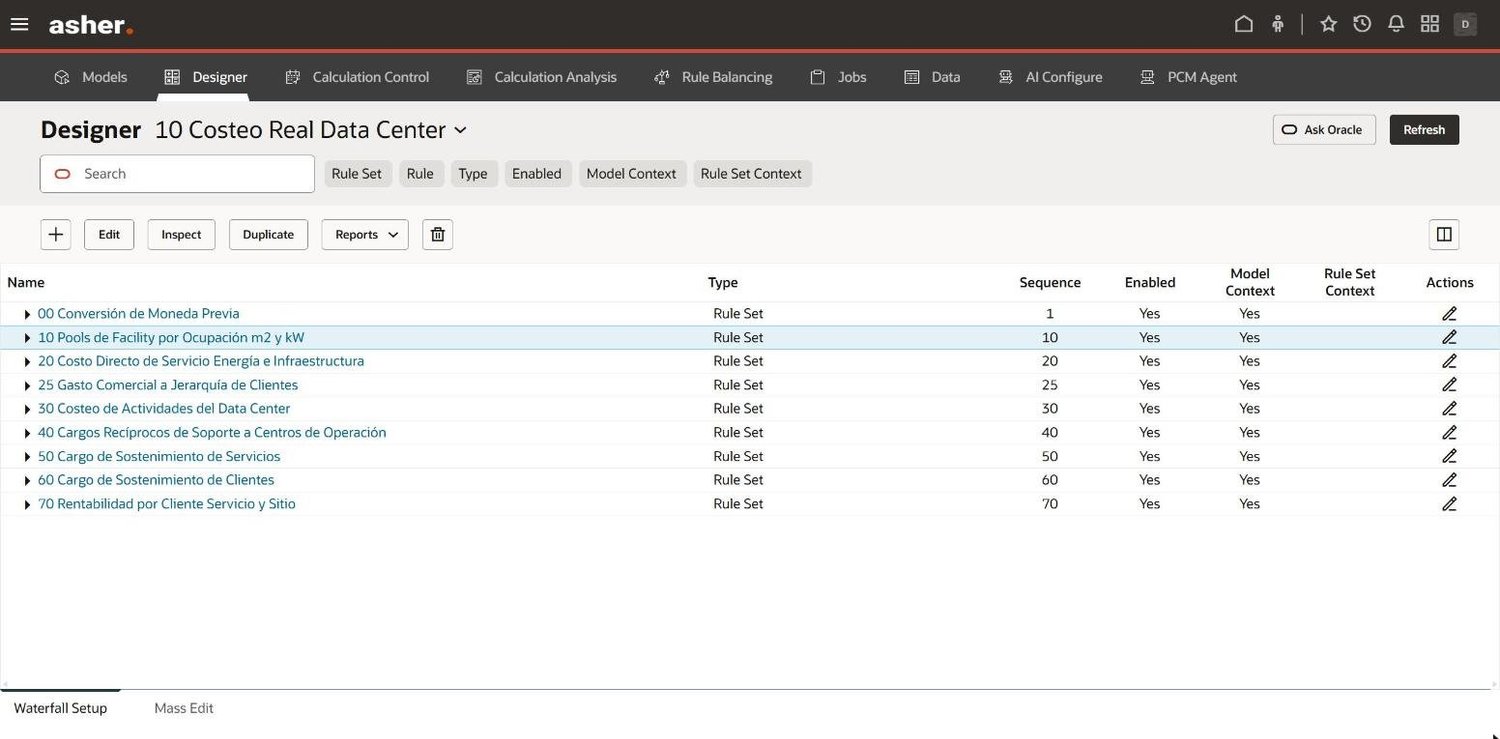
To test this logic, I built a data center costing model end to end in Oracle EPCM. Nine rule sets carry cost from the general ledger to facility pools, halls, IT services and customers, with reports, dashboards and a monthly close. It runs on sample data, so it demonstrates the logic and the decisions it supports. Results for a real operator come once the model is loaded with that operator's GL, DCIM data and contracts.
The full point of view is in the deck Data Centers in the AI Era: Cost and Capacity Management (PDF). It covers the value tree, the price floors, the AI options inside Oracle EPM and two illustrative cases. You can see more screens of the model at asher.company/datacenter.
Scarcity is temporary. A twelve-year minimum bill is not. Build so that every megawatt earns its long-run cost.
If you want to compare notes on your own capacity numbers, write to me at psanmartin@asher.company.
Pedro San Martín is Founder & Principal of Asher & Company and Chair of the IMA Profitability & Cost Management SIG.
Sources: CBRE, North America Data Center Trends H1 2026; Bain & Company, Global Technology Report (Sept. 2025); Lawrence Berkeley National Laboratory and Brattle, Electricity Rate Designs for Large Loads, 2026 Update (Aug. 2026); AEP Ohio, Data Center Tariff (PUCO order, July 2025); Virginia SCC, Case PUR-2025-00058 (Nov. 2025); PJM Base Residual Auction reports 2024/25–2028/29; Monitoring Analytics via Utility Dive (Jan. 2026); Alphabet, Form 10-K FY2023; CNBC (Feb. and Nov. 2025); Cushman & Wakefield, Data Center Development Cost Guide 2026; MIT Technology Review (Mar. 26, 2025); Reuters (July 2025); The American Prospect (Sept. 2002); Equinix Q4 2025 results; Digital Realty Form 10-K FY2025; Uptime Institute, Global Data Center Survey 2025; Kaplan & Anderson, Time-Driven Activity-Based Costing (2007); CAM-I Capacity Model. Hyperscaler capex figures are company guidance compiled by analysts and change every quarter. The worked example and the demo figures are illustrative. This post is my reading of public sources and is not investment advice.
